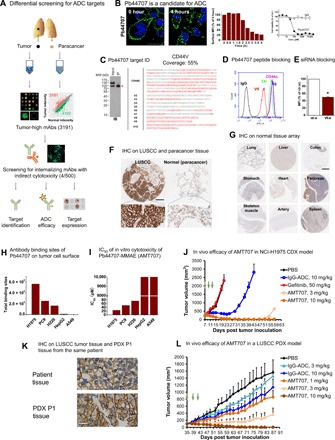
Fig. 4. Differential array screening for ADC therapeutic target/antibody discovery.

(A) Differential antibody screening for ADC targets. Inset scatter plot shows differential distribution of antibody signal intensity of NSCLC and normal lung. n = 1. More than 3000 tumor-high antibodies were identified. (B) An antibody candidate, Pb44707, for ADC. Antibody ID was labeled on the left of the IF image. IF (0 and 4 hours) image (green, antibody; blue, DAPI) time course of normalized surface fluorescence in FACS and cell cytotoxicity data are shown. Internalization half time (t1/2) and mean percent growth inhibition ± SEM (n = 3) of the antibody is labeled. IF scale bar, 50 μm. (C) Pb44707 IP and MS. MS identified multiple peptides (sequence marked in red) from CD44s and peptide sequences from variable region (shown as V number). (D) Peptide blocking of CD44v9. Graph of FACS analysis showing CD44v9 peptide but not CD44v6 peptide nor CD44s protein blocking binding of Pb44707 with PC9 cells. (E) siRNA targeting CD44v9 specifically decreases the FACS signal of Pb44707 compared to control siRNA. Normalized MFI ± SEM of PC9 cells as detected by Pb44707. (F) Representative images of the IHC staining of Pb44707 in LUSCC tumor tissue and paracancerous tissue from one patient. Scale bar, 300 μm. (G) Images of the IHC staining of Pb44707 in representative vital normal human tissues. No expression of CD44v9 is detected in these tissues. Scale bar, 400 μm. (H) Quantification of total binding sites of Pb44707 on the plasma membrane of a variety of tumor cell lines. (I) IC50 of Pb44707-ADC on tumor cell lines. n = 1 to 3 for different cell lines, respectively. (J) Growth curves of the NCI-H1975 CDX tumors of different treatment groups (n = 7 per group). Treatment with AMT707, control ADC, or gefitinib (intraperitoneal injection, dosing once a day) was initiated 7 days after tumor inoculation and administered as indicated by arrows. (K) Representative images of the IHC staining of Pb44707 in a LUSCC patient tumor tissue (top) and passage 1 (P1) PDX tumor tissue derived from the same patient. Scale bar, 50 μm. (L) Growth curves of the PDX tumors of different treatment groups (n = 6 per group). Treatment with AMT707 or control ADC was initiated 35 days after tumor inoculation and administered as indicated by arrows.
