
Fig. 3. When 7-week-old Rbp2−/− and matched WT mice are placed on a high-fat diet (60% of calories from fat), the Rbp2−/− mice gain significantly more body weight than WT.
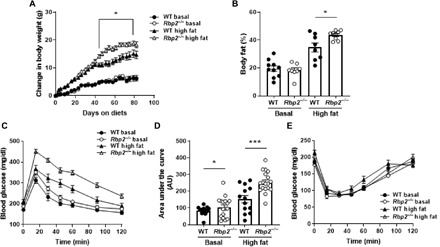
(A) Weight gain curves for Rbp2−/− and WT mice maintained on either a high-fat diet or a purified control diet (10% of calories from fat). (B) Upon 10 weeks of high-fat diet feeding, as determined by dual-energy x-ray absorptiometry, Rbp2−/− mice accumulate significantly more body fat than WT mice. (C and D) As seen from the plasma glucose clearance curves following an intraperitoneal challenge with glucose (C) and the resulting AUCs (D), the high-fat diet–fed Rbp2−/− mice respond significantly less well to the glucose challenge than WT mice. (E) The responses of matched Rbp2−/− and WT mice were not different following an intraperitoneal challenge with insulin. All data are presented as means ± SEM. Statistical significance: *P < 0.05 and ***P < 0.001.