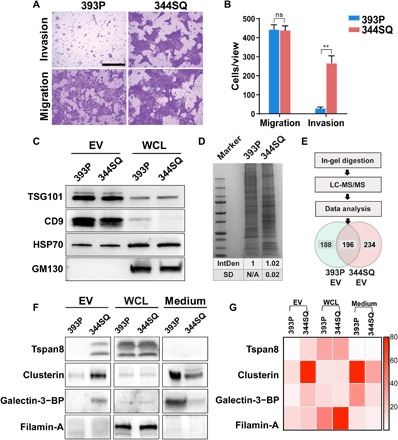
Fig. 1. Characterization of 393P and 344SQ cell phenotype and EV protein expression.

(A) Representative images and (B) graph of the migration and invasion phenotypes of the murine 393P (nonmetastatic) and 344SQ (metastatic) NSCLC cell lines. Scale bar, 100 μm. Data are means ± SEM from three independent experiments; ns, not significant; **P < 0.01. (C) Western blot of EV markers TSG101, HSP70, and CD9 and the Golgi (cytosol) marker GM130 in EVs or whole-cell lysates (WCLs) of 393P and 344SQ cells. (D) Coomassie-stained SDS-PAGE of 393P or 344SQ cell EV isolates; IntDen, relative mean and SD of the integrated lane densitometry from three replicates. N/A, not applicable. (E) Venn diagram of EV proteins identified by LC-MS/MS. (F) Western blot of proteins in EVs, WCLs, and EV-depleted medium. BP, binding protein. (G) Heat map of 393P versus 344SQ EV Western blot expression from low (light red) to high (dark red) optical density.
