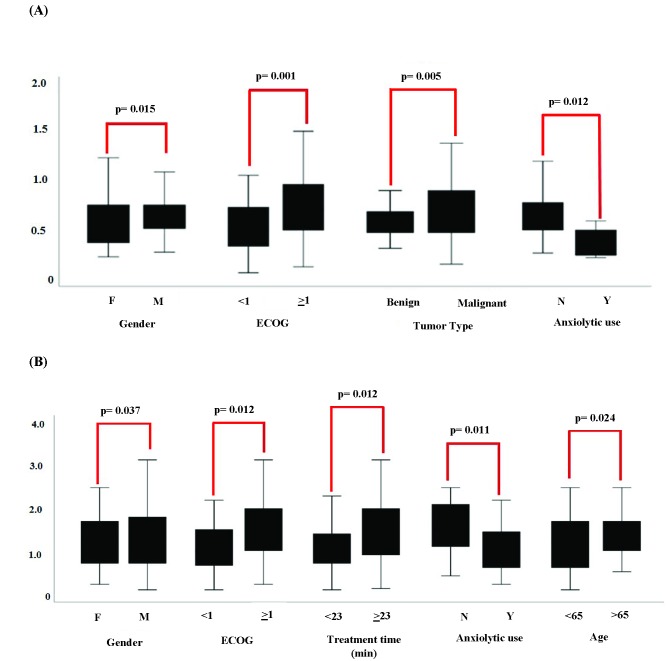
Figure 2.
Box plots demonstrate median and range of average displacement with regard to various to patient and treatment characteristics; p values designate results from logistic regression analysis.
Demonstrates factors that showed a significant association with increased average displacement.
Demonstrates factors that showed a significant association with increased maximum displacement.

