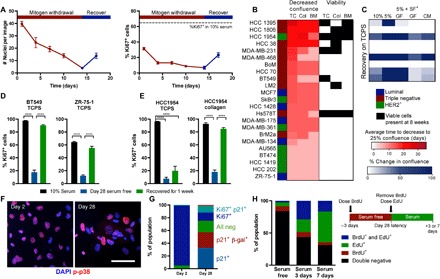
Fig. 1. Serum withdrawal induces a reversible dormant phenotype in breast cancer cells.

(A) ZR-75-1 breast cancer cell line number and proliferation (Ki67 staining) over time with serum withdrawal (red) and recovery in full serum (blue). (B) Survival of breast cell lines on TCPS (TC), collagen I coverslips (Col), or a mixture of ECM proteins inspired by those found in the bone marrow (BM)–functionalized coverslips. Average time to decrease confluence from 100 to 25% (scored by visual inspection by the same observer) is displayed on the left in red, and conditions where viable cells were detected at 8 weeks in culture are labeled on the right in black. (C) Best-performing cell lines were cultured on TCPS for 6 weeks and stimulated with varying media conditions (GF, growth factor cocktail; CM, conditioned medium from mesenchymal stem cells). SF, serum-free. Heat map shows increase in confluence over 7-day stimulation in blue. (D) Ki67 quantification of BT549 and ZR-75-1 plated on TCPS and (E) of HCC 1954 on TCPS or collagen. Black, 10% serum control; blue, day 28 serum-free culture; green, 7-day recovery. (F) Immunofluorescent staining for phospho-p38 (red; Thr180/Tyr182) and 4′,6-diamidino-2-phenylindole (DAPI) (blue) in HCC 1954 on collagen coverslips after 2 and 28 days of serum starvation (scale bar, 100 μm). (G) Population quantification of HCC 1954 via costaining of Ki67, p21, and senescence-associated β-galactosidase (β-gal). (H) BrdU- and EdU-labeling experiment schematic and results for HCC 1954 on collagen. Black, double negative; red, BrdU positive; green, EdU positive; blue, double BrdU and EdU positive. P < 0.05 was considered statistically significant. P < 0.05 is denoted with *P < 0.05, and ****P ≤ 0.0001.
