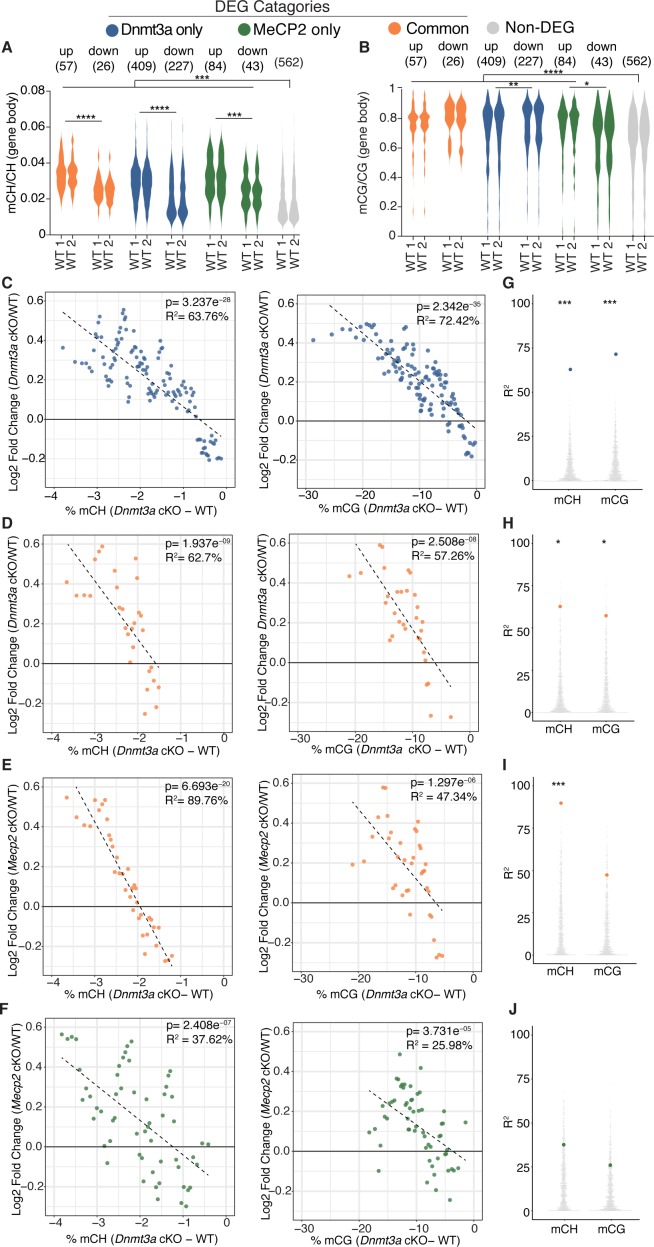
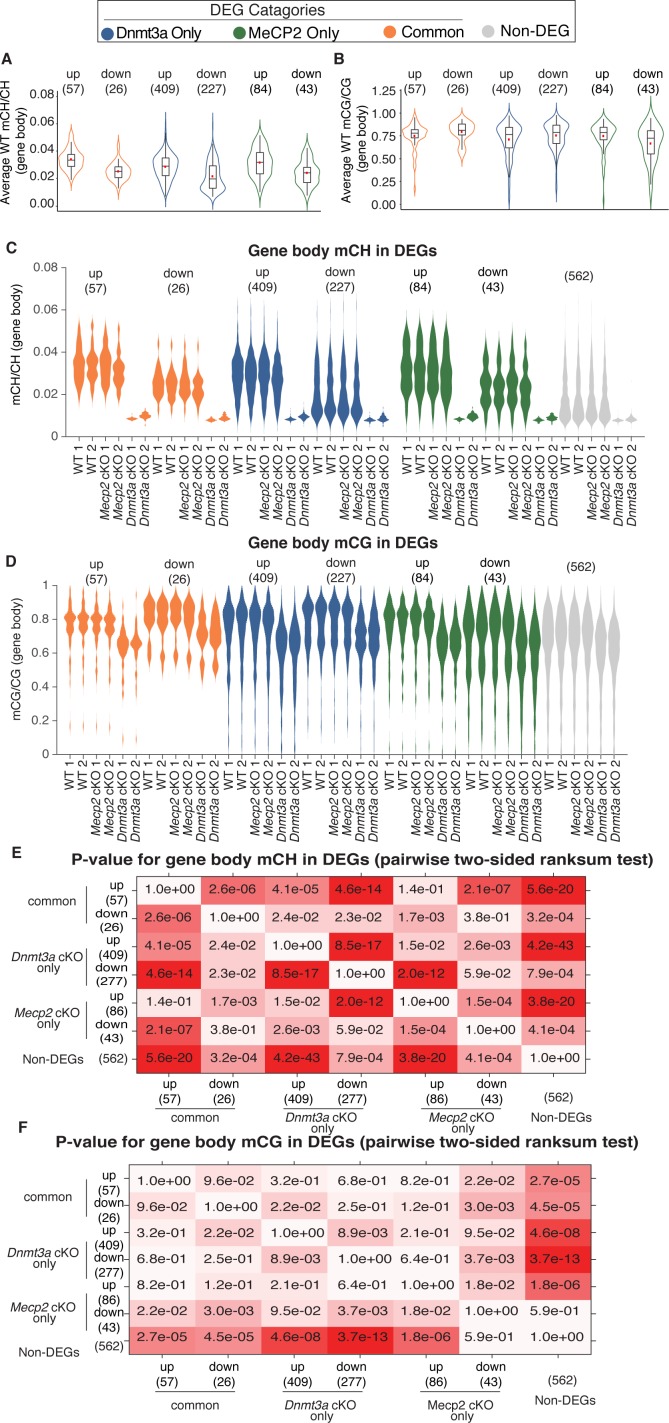
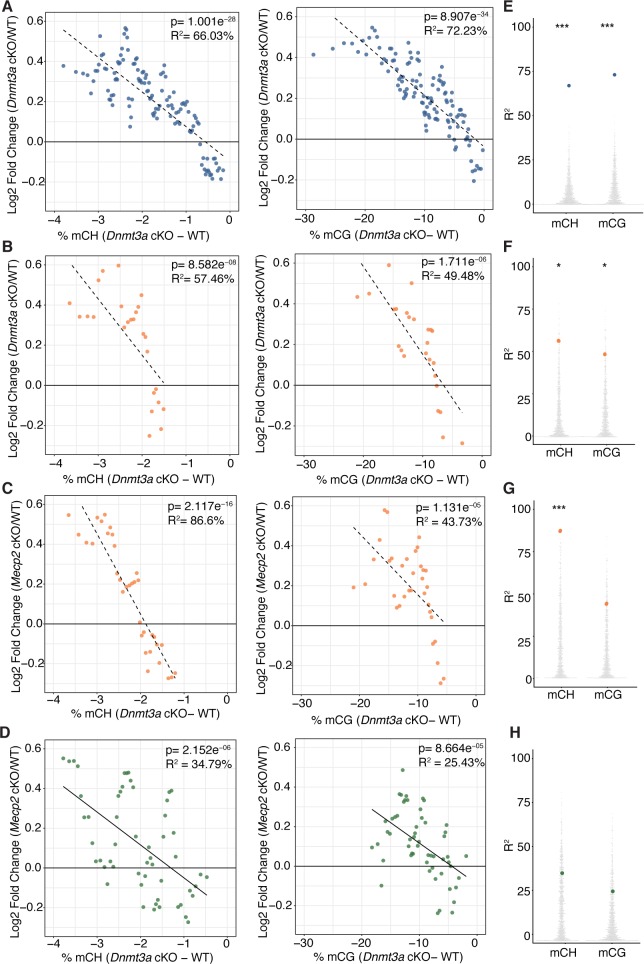
Figure 4. Integrative gene expression and methylation analysis shows mCH and mCG loss contribute to Dnmt3a cKO DEGs, and reveals a strong mCH contribution to RTT.
(A) Gene-body mCH levels in different categories of DEGs in WT mice are plotted, highlighting that misregulated genes have higher mCH than genes that are unchanged and the significant differences between mCH levels on up- and down-regulated genes. (B) Gene-body mCG levels in different categories of DEGs in WT mice are plotted, demonstrating that misregulated genes (with the exception of MeCP2 down-regulated genes) have higher mCG than genes that are unchanged and the significant differences between mCG levels on up- and down-regulated genes. (C) Running average plot of log2fold change in gene expression for genes significantly misregulated only in the Dnmt3a cKO model versus the change in mCH methylation observed in the Dnmt3a cKO model (‘Dnmt3a dependent mCH methylation’) (left). Running average plot of log2fold change in gene expression for these same genes versus the change in mCG methylation observed in the Dnmt3a cKO (‘Dnmt3a dependent mCG methylation’) (right). (D) Running average plots of log2fold change in gene expression in the Dnmt3a cKO model for genes commonly misregulated in both cKO models versus Dnmt3a dependent mCH (right) and mCG (left). (E) Running average plots of log2fold change in gene expression in the MeCP2 cKO for genes commonly misregulated in both cKO models versus Dnmt3a dependent mCH (right) and mCG (left). (F) Running average plots of log2fold change in gene expression for genes that are only significantly misregulated in the MeCP2 cKO model. (G–J) R2 values from analysis in panels C-F shown as blue, orange or green dots, respectively, plotted over 1000 random repetitions of the analysis with each repetition containing the same number of non-DEGs (padj >0.01). The results of random repetitions are shown as gray dots. All plots were made with DEGs padj <0.01. n = 2 mice per genotype for methylation data. n = 4 mice per genotype (RNA-seq). *p<0.05, **p<0.01, ***p<0.001, ****p<0.0001.


