
Figure 1. p16 expression in NP cells from human interverbal discs with different degrees of degeneration (G2–G5 groups according to Pfirrmann grade).
(A) Representative images of H and E staining showing cell/tissue general morphology. Safranin O staining with collagen and NP cells appearing orange and fibers blue/violet. Masson staining with collagen and NP cells appearing blue and fibers red; and immunohistochemical staining for p16. (B) Quantification of p16-positive cells (%). p16 protein levels were assessed by (C) western blotting and (D) measured by densitometric analyses and expressed as folds relative to grade 2 (G2) NP samples. Data are presented as mean ± SD (n = 3); *p<0.05; **p<0.01.
Figure 1—source data 1. Source data and related summary statistics for Figure 1A and C.
elife-52570-fig1-data1.xlsx (189.2KB, xlsx)

Figure 1—figure supplement 1. Representative magnetic resonance imaging (MRI) scans of patients with different categories of disc degeneration according to Pfirrmann grade.

Grades 2–5: G2–5. The yellow arrow indicates the surgical site.
Figure 1—figure supplement 2. Pffirmann grade of the degenerated disc from the human specimens correlates individually with p16 expression. ***p<0.001.
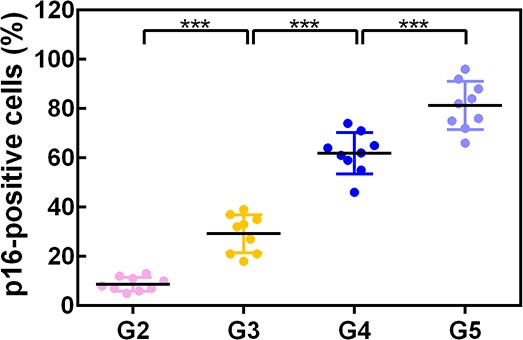
Figure 1—figure supplement 2—source data 1. Related summary statistics.
elife-52570-fig1-figsupp2-data1.xlsx (8.6KB, xlsx)