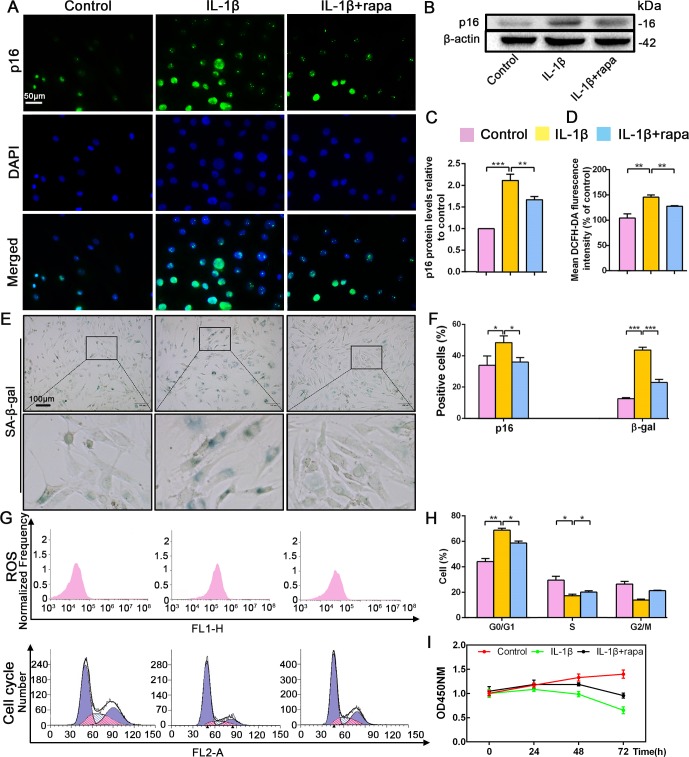
Figure 3. Effect of rapamycin (50 nM) on senescence, reactive oxygen species (ROS) levels and NP cell proliferation upon IL-1β stimulation (10 ng/mL).
Human NP cells were grouped as follows: normal cultured cells (control), IL-1β treated cells (IL-1β), and rapamycin-stimulated cells treated with IL-1β (IL-1β+rapa). (A) Representative immunofluorescent micrographs stained for p16. p16 protein levels as (B) assessed by western blotting and (C) measured by densitometric analysis, with results expressed relative to the control. (D) Quantitation of ROS levels. (E) SA-β-gal staining. (F) Total p16‐positive and β-gal‐positive cells (%). (G) ROS levels and the cell-cycle distribution of freshly collected human NP cells as determined by flow cytometry. (H) Cell-cycle distribution. (I) Cell proliferation as assessed by CCK-8 assays. Data are presented as mean ± SD (n = 3). *p<0.05; **p<0.01; ***p<0.001.

