Figure 4. p16 deletion delayed mouse intervertebral disc degeneration (IVDD).
WT and p16 KO mice were fed on the ground or with tail suspension (TS). (A) Radiographs of overall mouse length. (B) After H and E staining and Safranin O staining, collagen and NP cells are orange, and fibers are blue. (C) The intervertebral disc height index as calculated on the basis of lumbar vertebrae. (D) Associated protein levels as assessed by western blotting and (E) as measured by densitometric analysis, with results expressed relative to those in WT mice. (F) Target mRNA expression assessed by RT-PCR relative to GAPDH expression. (G) IL-1β, IL-6 and TNF-α levels in disc tissues as determined by ELISA. (H) The modified Thompson classification as assessed on the basis of lumbar disc signals. (I) Safranin O-positive area (%). Data are presented as mean ± SD (n = 3); *p<0.05; **p<0.01; ***p<0.001.

Figure 4—figure supplement 1. Establishment of TS-induced mouse IVDD model.

Figure 4—figure supplement 2. Representative micro-MRI of mouse intervertebral discs.
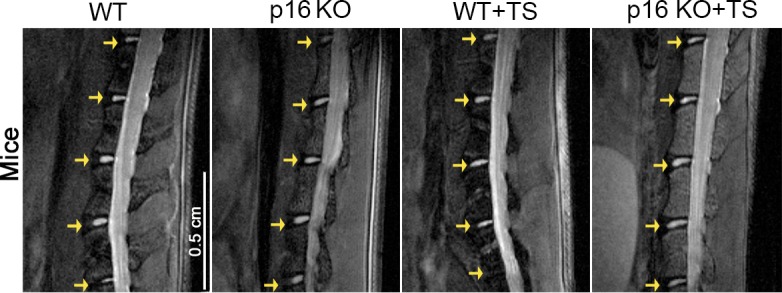
Figure 4—figure supplement 3. Pffirmann grade of degenerated disc from the mice specimens.
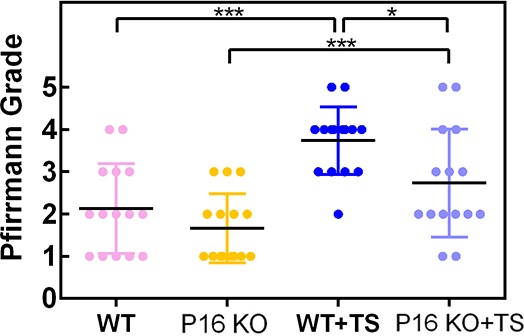
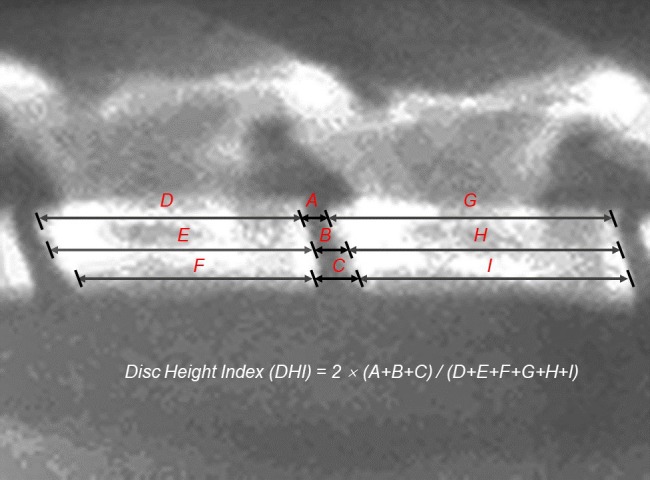
Figure 4—figure supplement 4. The intervertebral disc height index (DHI) was calculated by averaging the measurements obtained from the (A) posterior, (B) middle, and (C) anterior portions of the intervertebral disc and dividing these values by the average height of the adjacent (D–I) posterior, middle, and anterior portions of the vertebral body.