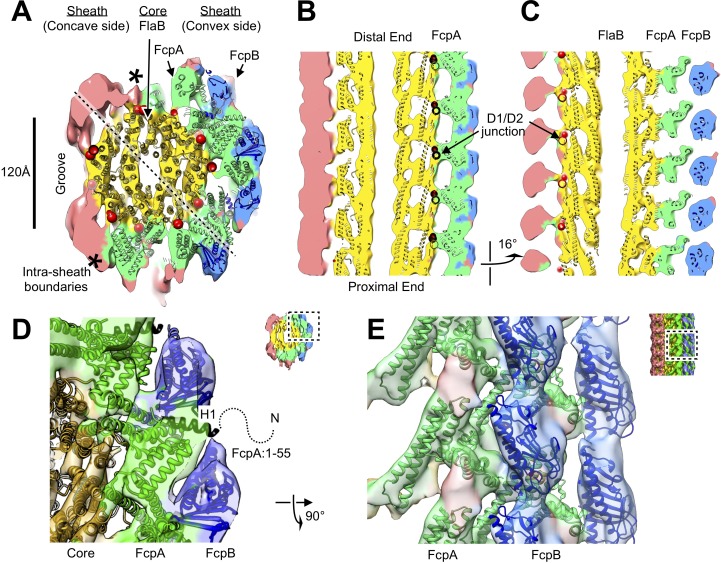
Figure 3. Atomic model of the core and sheath regions of the L. biflexa flagellar filament obtained by docking X-ray crystal structures into the cryo-EM map.
(A) Cross-sectional slice of the filament density map isosurface with fitted models of the pseudo-symmetric core assembly (yellow ribbons) and two sheath components, FcpA and FcpB, which localize to the filament outer curvature. Six FcpA protofilaments (green ribbons) directly contact the core and support an outer layer consisting of four FcpB protofilaments (blue ribbons). Asterisks denote boundaries between FcpA and inner curvature density (red). Red markers denote the location of the junction between the modeled D1 α-helical domain of FlaB and the species-specific insertion that substitutes for the D2/D3 outer domains found in Salmonella spp. FliC (flagellin) but not in Leptospira spp. FlaB. (B) Longitudinal slice through the filament center, corresponding to the dashed line in A, showing the central channel surrounded by the core and sheath layers. The major interface region between FcpA and the core coincides with this insertion. (C) A 16° rotated view of the map in B showing core-sheath contacts at the site of the FcpB insertions on the opposite side of the filament (concave side); identity of the sheath protein (red) is unassigned. (D) Close-up cross-sectional view of the averaged filament map showing X-ray model fits of FcpA and FcpB in the outer curvature sheath region. (E) Close-up view of the averaged filament map rotated 90° relative to the view in D showing X-ray model fits.

