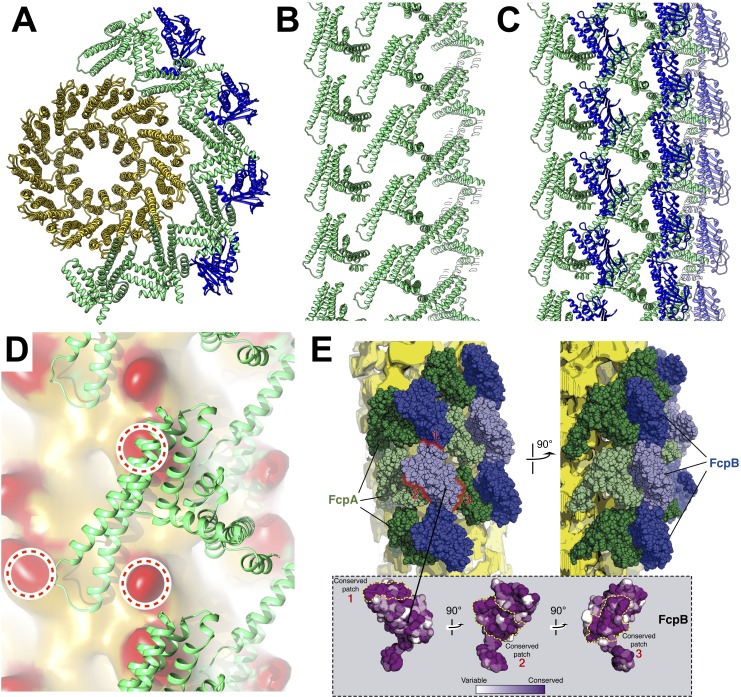
Figure 4. Predicted protein-protein interactions from the combined lattice and sheath model.
(A – C) Ribbon model depiction of the core-sheath atomic model; FlaB is colored gold, FlaA green, FlaB blue. (A) is an axial cross-section view, (B) is a lateral view of the FcpA lattice only, (C) shows the full FcpA/FcpB lattice. (D) Predicted interactions between FcpA (green ribbon) and predicted loop regions from FlaB (red, circled). (E) Conserved sequence elements on the FcpB surface are oriented towards neighboring FcpA molecules.

