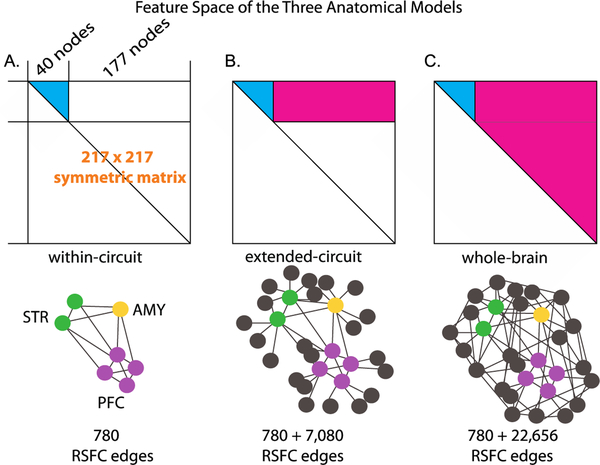
Figure 2. Illustration of the three anatomical models.
For each participant, the pairwise connectivity between the 217 nodes across the whole brain consisted of the 217 × 217 RSFC matrix symmetric about the diagonal. This matrix formed the initial connectivity feature space, with each cell of the matrix representing the connectivity strength between two nodes (i.e., an edge).The first two anatomical models involved a subsection of this connectivity space, and the third model covered the entire connectivity space. A. The within-circuit model. All possible pairs of connections between the PFC, and AMY nodes formed the RSFC connectivity space, resulting in 780 edges. B. The extended-circuit model. Connectivity between each of the nodes included in the within-circuit model (cyan) and of these within-circuit nodes to the rest of the brain (magenta), resulting in 7,080 additional edges. C. The whole-brain model. Connectivity between each of the nodes involved in the within-circuit model (cyan) and of these nodes to the rest of the RSFC connectivity space (magenta) were included, resulting in 22,656 additional edges compared to the within-circuit model. The bottom panel depicts these models using nodes and edges. For visual display clarity, not all possible nodes and edges were drawn.

