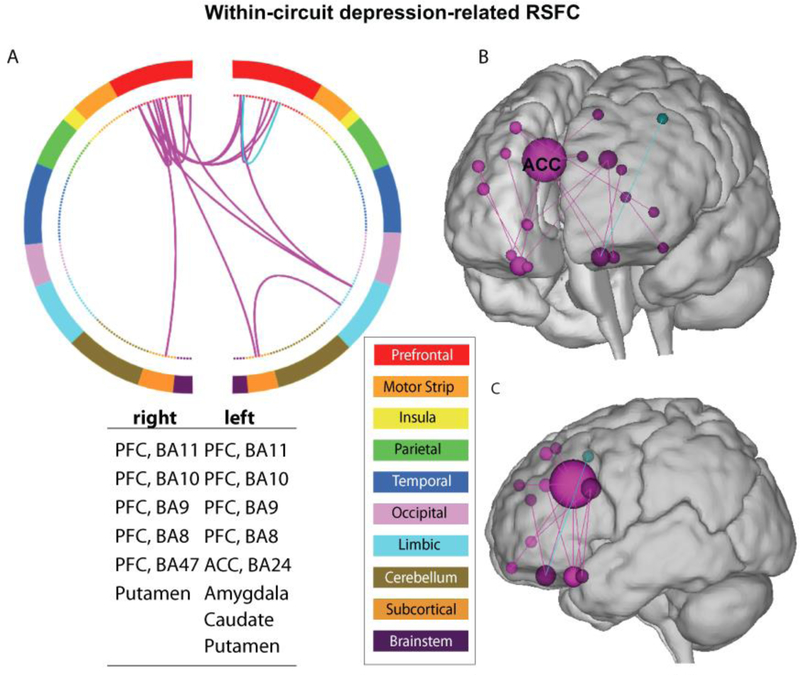
Figure 4. Key connectivity edges associated with adolescent depression.
A. circular plot organizes the 268 nodes (inner circle) from the original atlas into 10 anatomical regions (outer circle). These regions were organized roughly from anterior to posterior (top to bottom), with the right and left hemisphere in split halves. The color of the nodes and edges indicates positive (magenta) and negative (cyan) correlation with depression scores surviving the 95% thresholds. Regions between which the depicted edges connect were listed in the table under the circular plot. B. The same edges shown in A are shown on the glass brain. The size of the nodes indicates the number of edges connected with the corresponding node. C. The edge distribution showing the high-connectivity (>=3 connectivity) nodes with their edges in the glass brain. The Yale Connectivity Viewer, an online visualization tool was used to generate the corresponding figures (http://bisweb.yale.edu/build/connviewer.html).

