
FIGURE 1:
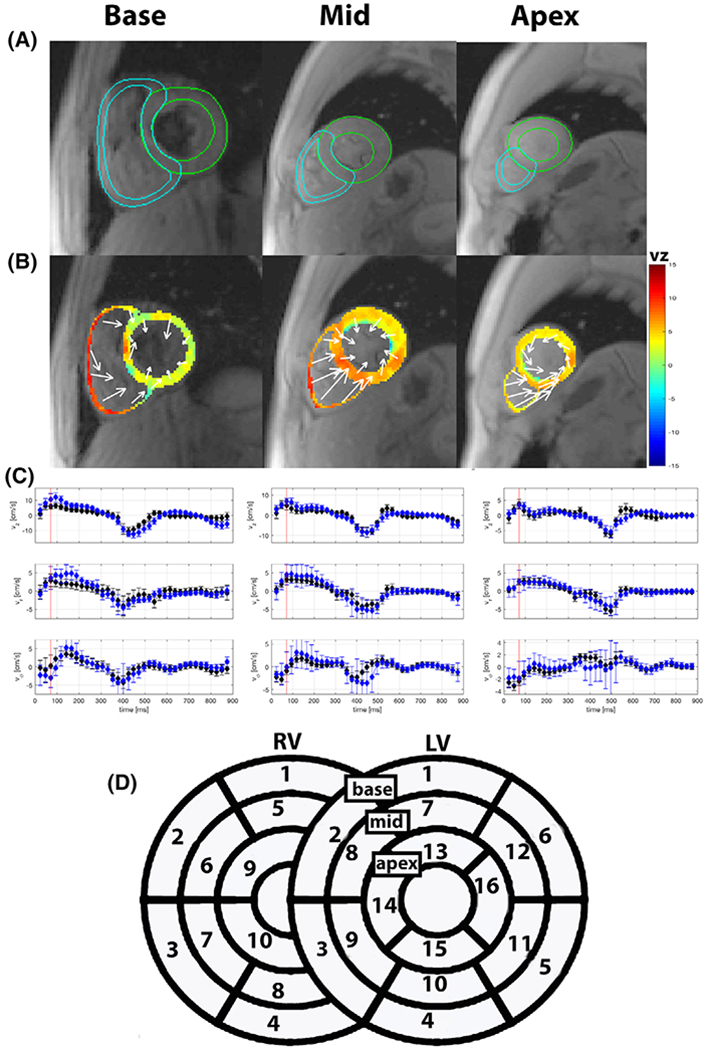
TPM data analysis. Epicardial and endocardial RV and LV contours were manually drawn across all three slices (a). From these contours, myocardial velocities were extracted. The velocities are displayed with color-coded long-axis velocities (through-plane) and in-plane velocity vectors (b). LV and RV velocities were converted from Cartesian coordinates to long-axis, radial and circumferential directions. Slice averaged velocity–time curves (c) for each velocity component were obtained from the segmented LV and RV (black: left ventricle, blue: right ventricle). Peak radial and long-axis velocities were extracted from the velocity–time curves for each segment in an extended 16 + 10 AHA model (d)