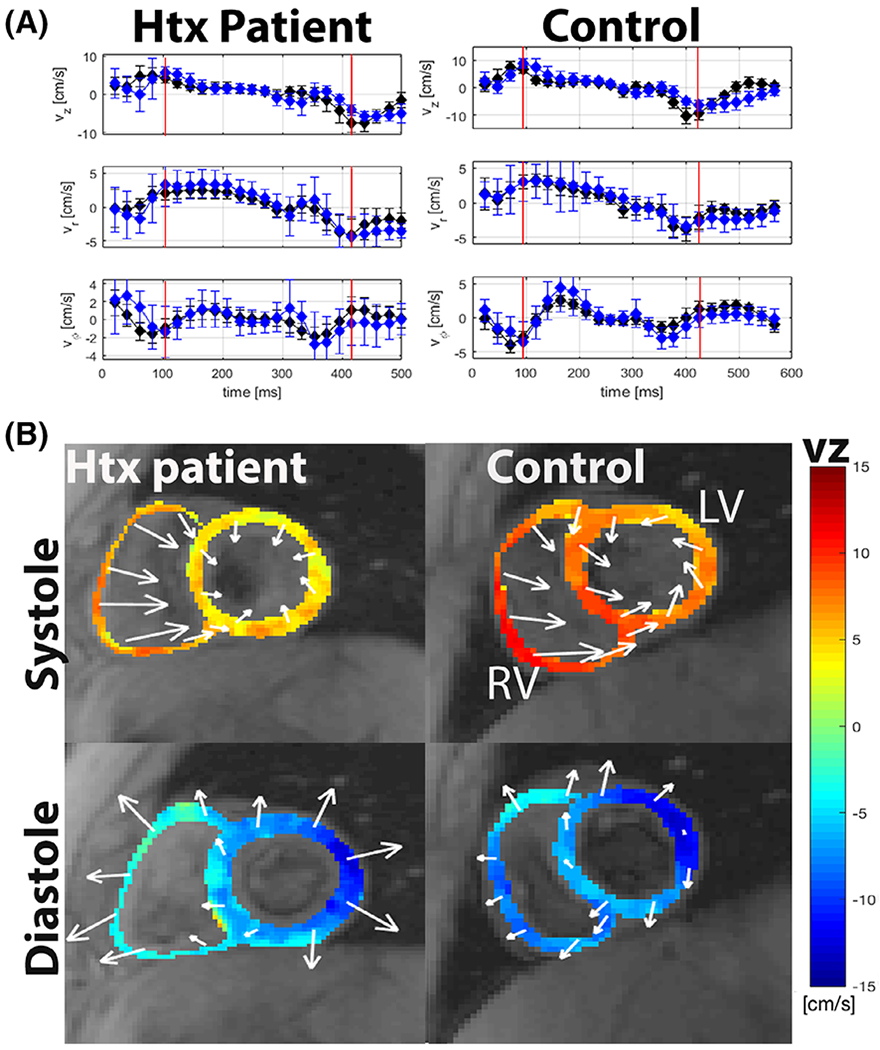
FIGURE 2:

Myocardial velocities in the basal slice compared between a Htx patient (age = 14 years) and a control subject (age = 15 years). a: Velocity–time curves for each velocity component (from top to bottom: long-axis velocities (vz), radial velocities (vr), and circumferential velocities (vφ) are displayed for the Htx patient (left) and control subject (right). b: Examples of color-coded myocardial long-axis (vz) velocity differences between Htx patient and control at the indicated timepoints (red lines in a) in the velocity–time curves. The color bar on the right indicates the long-axis velocity values, while the arrows represent the regional in-plane velocity vectors. The Htx patient had lower long-axis velocities at both systole and diastole compared with the control.
