
FIGURE 4:
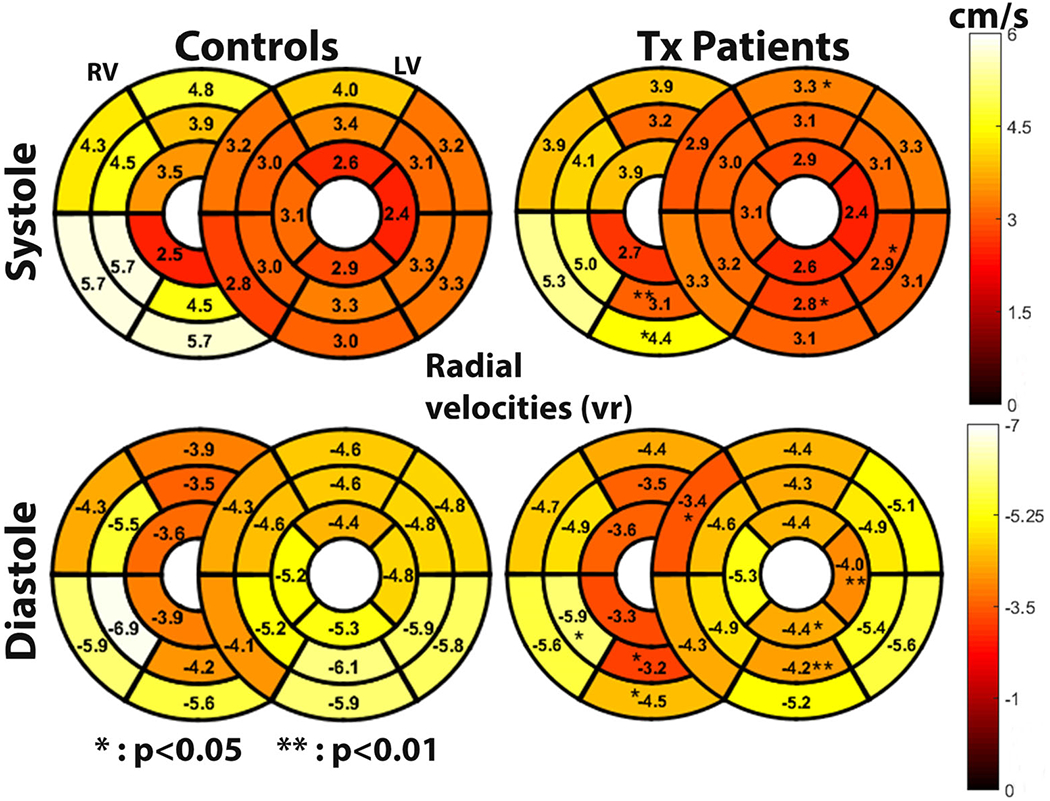
Comparison of segmental velocities between Htx patients (right) and controls (left) for radial systolic (upper row) and diastolic (lower row) velocities. The color-coded bulls-eye plots visualize the difference in velocity across the 16 + 10 AHA LV + RV segments. For the LV, 3/16 segments during systole and 4/16 during diastole were found to have significantly reduced velocities in Htx patients, while for the RV, velocities in 2/10 segments during systole and 3/10 during diastole were significantly reduced. Significance is denoted by *P < 0.05 and **P < 0.01.