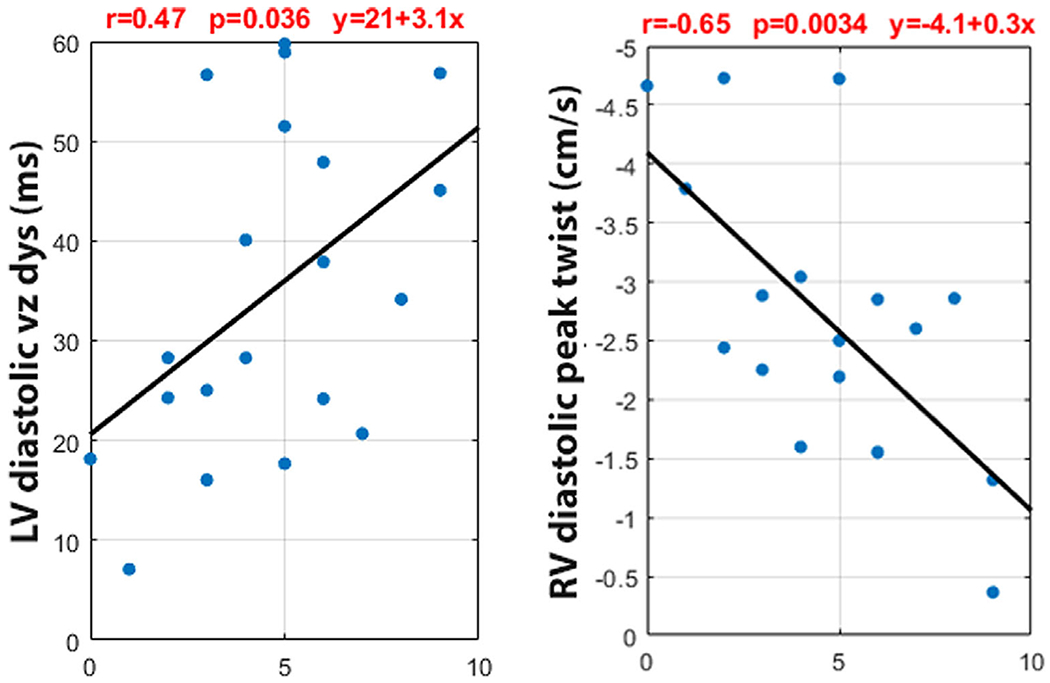
FIGURE 5:

Correlation plots showing the relationship between the LV diastolic long-axis dyssynchrony and RV diastolic peak twist to the number of rejection episodes for Htx patients. The Pearson correlation value (r) was 0.47 and −0.65, respectively, and P of 0.036 and 0.0034. LV: left ventricle, vz: long-axis, dys: dyssynchrony, RV, right ventricle.
