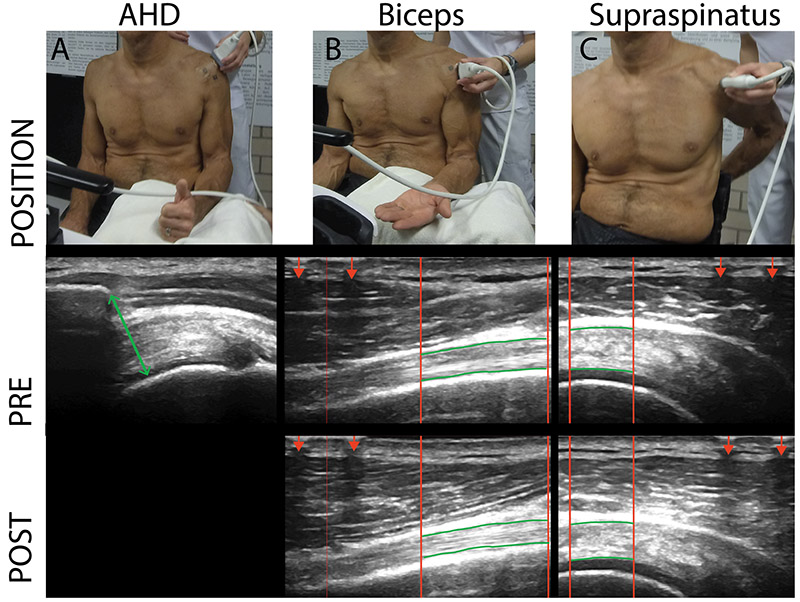
Figure 2:
Position and example images of ultrasound measurements. Each type of measurements represents a different example participant and does not relate to the person of the position images. (A) Acromio-humeral distance images were taken in a seated position with 90° elbow flexion with the thumb facing upwards. (B) Longitudinal images of long head of biceps brachii tendon were taken in a seated position with 90° elbow flexion and the hand palm facing upwards. (C) Transverse ultrasound images of supraspinatus tendon were taken in a seated position with the palm placed on the lower back, shoulder extended, and the elbow flexed posteriorly (B) The region of interest (ROI) is presented between the red vertical lines with the upper border and lower border of the tendons marked with the manually identified green horizontal lines. Lines are marked thicker as compared to the actual analysis for visualization reasons. ROI is selected based on the interference pattern that resulted from a metal marker taped to the skin (assigned with arrows).

