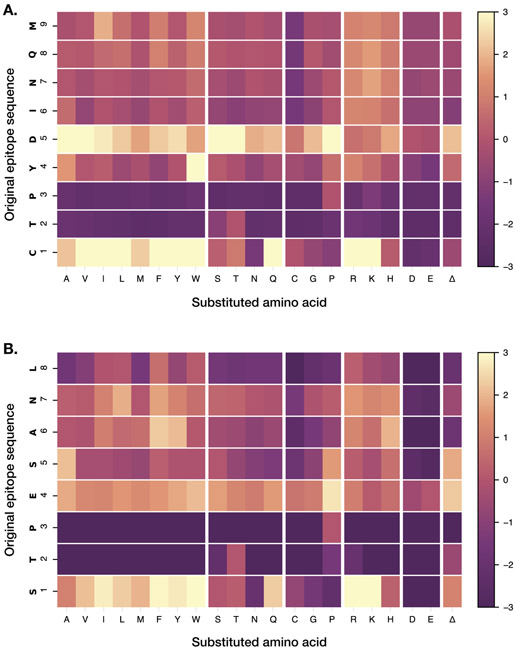
Figure 2: Identification of anchor residues by substitution analysis.
Single amino acid substitutions were made at each position of the Gag CM9 (A) and SL8 (B) epitopes. Each box represents a peptide with the indicated substitution, and the fold change in signal intensities for each substitution (compared to the wild-type sequence) is reported. Position numbers are reported along the left axis of the heatmap; the fold change color scale is indicated at right.

