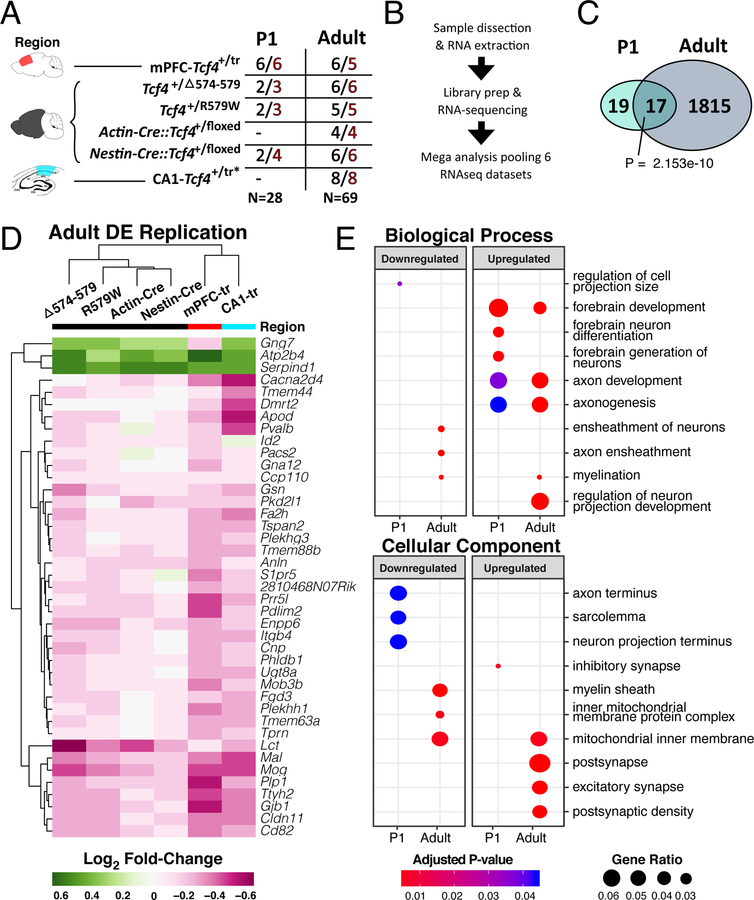
Figure 1: RNA-seq of multiple Tcf4 mutations reveal age-specific differential gene expression.
(A) Summary table of the 5 mouse lines of Tcf4 mutation sequenced in this analysis. Samples come from 3 regions, medial prefrontal cortex, hemibrain, and hippocampal CA1 (colored red, black, and teal, respectively). Two age groups, P0–2 (P1) and >P42 (adult), were assessed in this study. N’s of wild-type and PTHS mice are colored black and red, respectively. (B) General sample-to-analysis RNA-seq pipeline. (C) Venn diagram of DEGs in P1 and adult mice by Tcf4+/mut genotype across all mouse lines and tissue regions (FDR<0.05). There are 36 DEGs in P1 group, and 1832 DEGs in adult group. A significant group of 17 genes are differentially expressed in both P1 and adult age groups (Fisher’s exact test, p=2.153 e-10). (D) Log2 fold-change heatmap of DEGs from the mega-analysis shows high concordance of differential expression across other mouse lines (replication defined as the same gene also differentially expressed in another model with two-sided p<0.05). (E) Dot plot of gene ontology (GO) enrichment analysis of DEGs split by up- or down-regulated genes to determine functional pathways affected in PTHS mice brain (q-adjusted two-sided hypergeometric test, padj < 0.05). Gene ratio dot size represent % of genes for each GO term differentially expressed.

