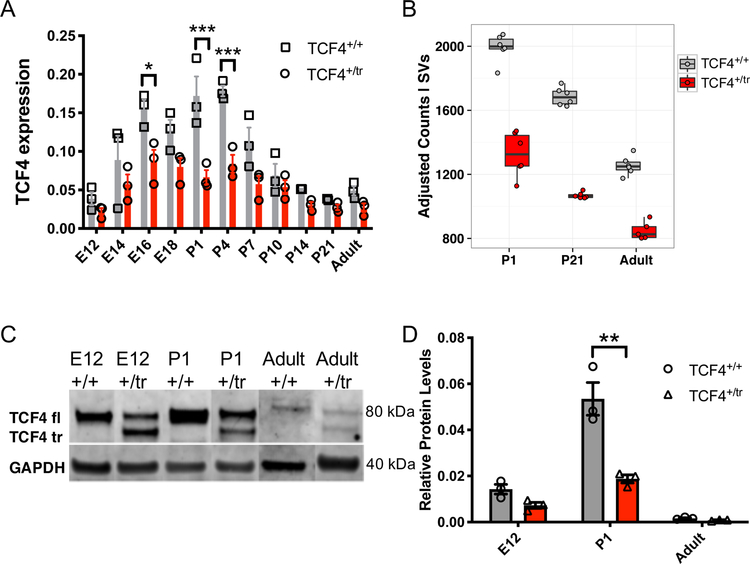
Extended Data Fig. 1. Heterozygous truncation of Tcf4 decreases levels of Tcf4 mRNA and protein.
Comparison of lifespan expression patterns of TCF4 in heterozygous (Tcf4+/tr) mice and wild-type (Tcf4+/+) littermates in qRT-PCR and RNA-sequencing analyses. mRNA and protein were extracted from frontal cortex of mice across developmental ages. (A) qRT-PCR analysis of full-length Tcf4 transcripts from mouse frontal cortex. Tcf4+/tr mice show overall reduced expression compared to Tcf4+/+ mice (n=66 mice, ANOVA p=0.02) with the greatest decrease inTcf4 expression around postnatal days 1–4 (P1–4, n=18 mice, Posthoc p<0.05). Center values represent mean and errors bars are S.E.M. (B) RNA-seq analysis also shows TCF4 expression decreased in the Tcf4+/tr mouse in the exon after the truncation (n=35 mice). Tcf4+/tr mice had significant decrease of Tcf4 exons (differentially expressed exon by genotype FDR = 3.35 x 10⁻³⁵). The boxplot shows the quartile breaks of residualized variance stablilized count of a Tcf4 exon after the truncation (see methods on residualization for visual interpretation). (C) Western blot of endogenous mouse TCF4 at three ages (E12, P1, and P42). A single full-length (TCF4 fl; 80kDa) protein is observed in lysates from Tcf4+/+mouse brain and Tcf4+/tr mouse brain expresses a truncated (TCF4 tr) and full-length TCF4 protein. These representative gel images are compiled across several different gel images and stitched together. (D) Full-length TCF4 protein is decreased in the Tcf4+/tr mouse brain (n=3 mice per genotype per timepoint, pAnova =0.0009) with the largest effect occuring at P1 in the TCF4+/tr mice (n= 3 mice per condition, two-sided unpaired t-test, p<0.01). Center values indicate mean and errors bars are the S.E.M., *<0.05, **<0.01, ***< 0.001.

