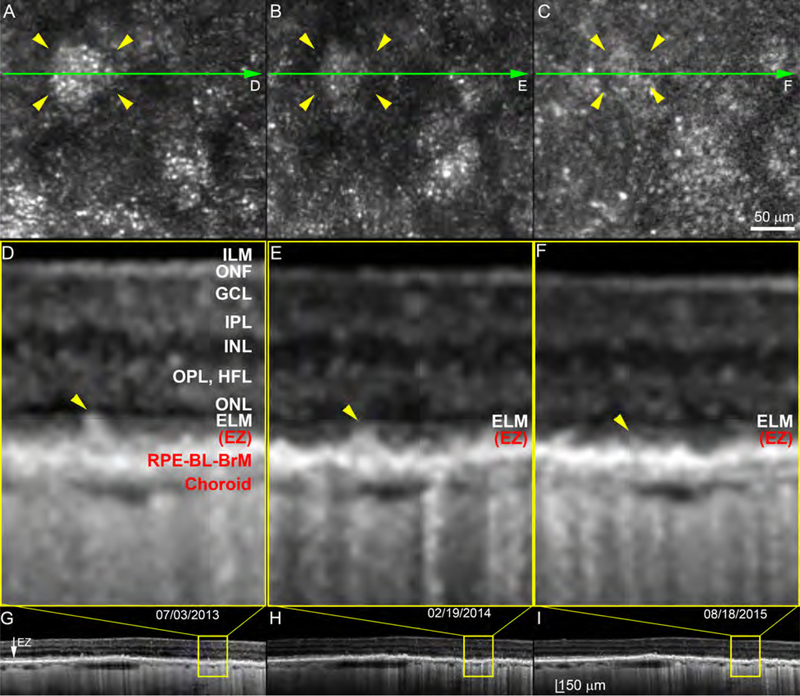
Figure 6.
Outer retinal atrophy and retinal pigment epithelium degeneration associated with subretinal drusenoid deposit regression. This patient was followed for 3.5 years by adaptive optics scanning laser ophthalmoscopy (see white boxes in Figure 5), which showed loss of both deposit reflectivity and the annulus representing deflected photoreceptors. Spectral-domain optical coherence tomography revealed an almost complete loss of the outer retinal architecture. Yellow arrowheads point to the regresseed SDD. In Panels DEF, distances from ILM to ELM are (respectively) 199, 191, and 180 μm. Thicknesses of ONL/HFL are 43, 34, and 26 μm. Photoreceptor lengths, defined as the outer portion of the OPL to the middle point of RPE,11 were 66, 54, and 47 μm. Thus thicknesses of ILM-ELM, ONL/HFL, and photoreceptors are 90.4%, 60.4%, and 71.2% of thicknesses two years prior. The ELM becomes less visible over time. The EZ is not clear at any time point. RPE cells are still present, but streaks of hypertransmission into the choroid indicate patchy RPE degeneration. The choroid is thin and has low vascularity at all time points. ILM: Internal limiting membrane, which is the inner boundary of the ONF. ONF: Optic nerve fibers. GCL: Ganglion cell layer. IPL: Inner plexiform layer. INL; Inner nuclear layer. OPL: Outer plexiform layer. HFL: Henle Fiber layer. ELM: External limiting membrane. EZ: elipsoid zone. RPE: retinal pigment epithelium. BL: basal lamina. BrM: Bruch’s membrane. The RPE-BL-BrM band includes the hyperreflective RPE, hyporeflective basal laminar deposit, and hyperreflective BrM. Due to space limitations, the entire complex is labeled together in panel D. As EZ has lost its continuity due to atrophy, we labeled EZ with brackets indicating its position. The scale bar in panel C applies for panels A and B. The scale bar in panel I also applies for panels G and H.

