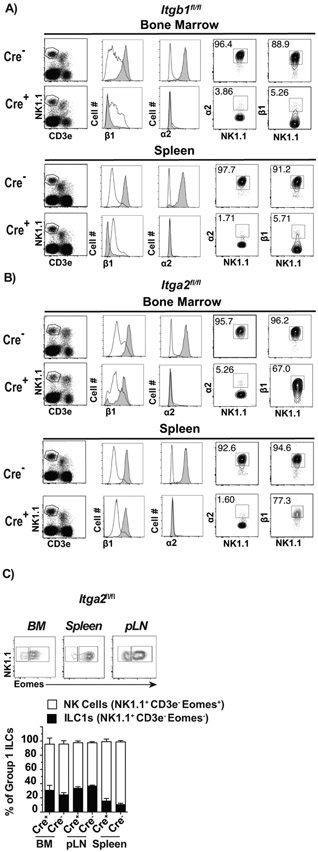
Figure 1: Generation and characterization of mice with NK cells deficient in α2β1.
Ncr1Cre+ mice were crossed with Itgb1fl/fl or Itga2fl/fl mice to generate Cre+-Itgb1fl/fl, Cre+-Itga2fl/f and Cre− littermate controls. A-B) Representative flow cytometry analysis in the indicated tissues and mouse strains: NK1.1 and T-cells were distinguished by CD3e and NK1.1 staining (left panels) on cells previously gated on FSC-A vs. FSC-H to eliminate doublets and on lymphocytes by FSC-H and SSC-H. From these plots, expression of α2 and β1 was determined on gated NK cells (CD3e− NK1.1+, gray histogram) or T-cells (CD3e+ NK1.1−, white histograms). These were used to establish the definitive gates for NK cells shown as contour plots on the right. C) Representative flow plots showing the gating strategy to identify ILC1s and NK cells in the indicated tissues based on NK1.1 and Eomes, and stacked columns depicting the frequencies of ILC1s and NK cells as mean ± SEM in different tissues. Data correspond to 2 independent experiments combined with a total of 6-8 mice/group.

