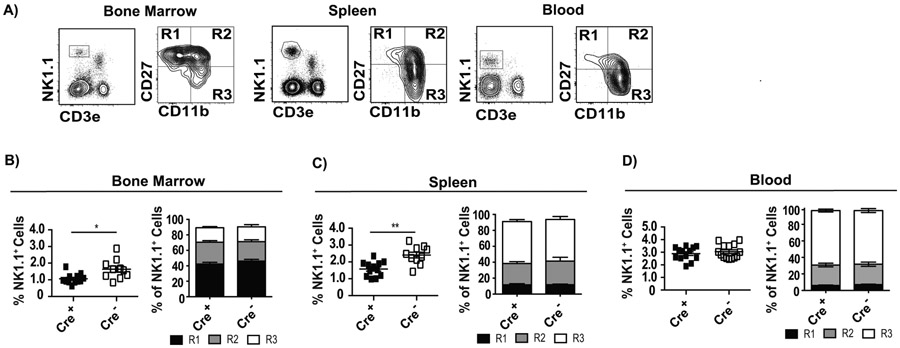
Figure 2: α2β1 affects, but not critically, the development of NK cells.
The indicated tissues from Cre+ and Cre− Itga2fl/fl mice were analyzed for the frequency of NK1.1+ cells and their maturation stages (R1, R2 and R3) according to CD27 and CD11b expression. A) Representative flow cytometry plots indicating the gating strategy. B-D) Summary graphs indicating the frequency of NK1.1+ cells in individual mice with mean ± SEM (left panels) and the mean ± SEM frequencies of R1 (CD27+ CD11b−), R2 (CD27+ CD11b+), and R3 (CD27− CD11b+) cells within the NK1.1+ CD3e− gate in the indicated tissues and mice. Data correspond to three or four independent experiments combined with a total of 11-27 mice/group. P-values were calculated using the Mann-Whitney U statistical test or ANOVA as necessary. For all, *p < 0.05; **p < 0.01; ***p < 0.001; ****p < 0.0001.

