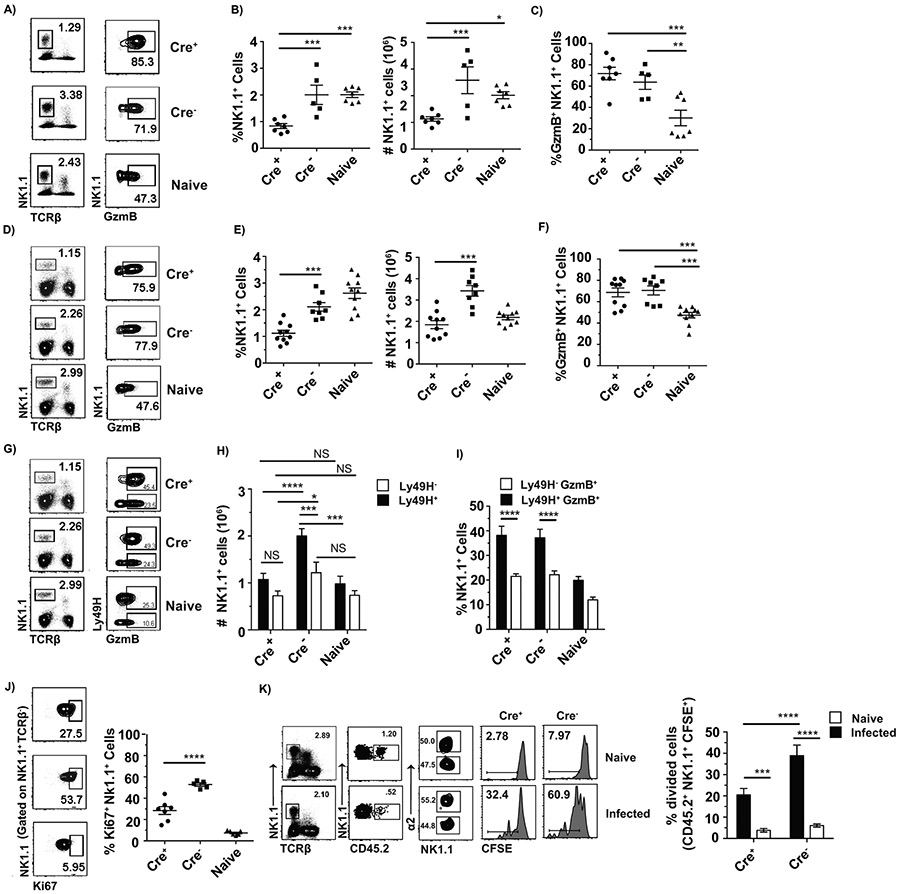
Figure 4: α2β1 is necessary for optimal NK cell proliferation in the spleen during ECTV and MCMV infections but is not required for the acquisition of NK cell effector functions.
Cre+ and Cre− Itga2fl/fl mice were infected with either 3,000 pfu of WT ECTV or 250,000 pfu of MCMV K181 (MCMV), and their spleens were analyzed at 120 hpi. Naïve B6 mice were used as an additional control. A) Representative flow cytometry plots showing the gating strategy for identification of total NK cells in indicated mice infected with ECTV, as well as intracellular expression of GzmB in total NK1.1+ cells. B) Dot plots depict the frequencies and total numbers with mean ± SEM of NK1.1+ cells that were in the spleen of ECTV infected individual Cre− or Cre+ Itga2fl/fl mice as indicated. Data are displayed as a combination of two individual experiments with a total n of 5-7 mice/group C) Dot plots depict the frequency with mean ± SEM of GzmB+ NK1.1+ cells that were in the spleen of ECTV infected individual Cre− or Cre+ Itga2fl/fl mice as indicated. Data correspond to two individual experiments combined with a total n of 5-7 mice/group. D) Representative flow cytometry plots showing the gating strategy for identification of total NK cells in indicated mice infected with MCMV, as well as intracellular expression of GzmB in total NK1.1+ cells. E) Dot plots depict the frequencies and total numbers with mean ± SEM of NK1.1+ cells in the spleen of MCMV infected individual Cre− or Cre+ Itga2fl/fl mice as indicated. Data are displayed as a combination of three individual experiments with a total n of 8-10 mice/group. F) Dot plots depict the frequency with mean ± SEM of GzmB+ NK1.1+ cells in the spleen of MCMV infected individual Cre− or Cre+ Itga2fl/fl mice as indicated. Data are displayed as a combination of three individual experiments with a total n of 8-10 mice/group. G) Representative flow cytometry plots showing the gating strategy for identification of total NK cells, as well as intracellular expression of GzmB in Ly49H+ or Ly49H− cells within the NK1.1+ population in mice infected with MCMV. H) Bar graphs depict the number of Ly49H+ NK1.1+ or Ly49H− NK1.1+ cells with mean ± SEM of NK1.1+ in the spleen of MCMV infected individual Cre− or Cre+ Itga2fl/fl mice as indicated. I) Bar graphs depict the frequency of GzmB+ cells with mean ± SEM in NK1.1+ Ly49H+ or y49H− cells in the spleen of MCMV infected individual Cre− or Cre+ Itga2fl/fl mice as indicated. Data are displayed as a combination of three individual experiments with a total n of 8-10 mice/group J) Dot plots depict the frequency with mean ± SEM of Ki67+ NK1.1+ cells in the spleen of ECTV infected individual Cre− or Cre+ Itga2fl/fl mice as indicated. Data are displayed as a combination of two individual experiments with a total n of 5-7 mice/group. K) Splenocytes from Cre+ Itga2fl/fl and Cre−- Itga2fl/fl were mixed at a 1:1 ratio labeled with 4 uM CFSE and transferred into recipient CD45.1 mice. Recipient mice were either naïve or infected with 3,000 pfu WT ECTV one day post transfer and their spleens analyzed at 120 hpi. Representative flow plots show the gating strategy for identification of adoptively transferred cells either WT and α2β1-deficient NK cells and the dilution of CFSE by either WT or α2β1-deficient NK cells. Bar graphs show the frequency of WT or α2β1-deficient NK cells that diluted their CFSE in the spleen of individual mice with mean ± SEM. Data corresponds to three individual experiments combined with a total n of 8-11 (naïve) and 10-12 (infected) mice/group. P-values were calculated using the Mann-Whitney U statistical test or ANOVA when necessary. For all, *p < 0.05; **p < 0.01; ***p < 0.001; ****p < 0.0001.

