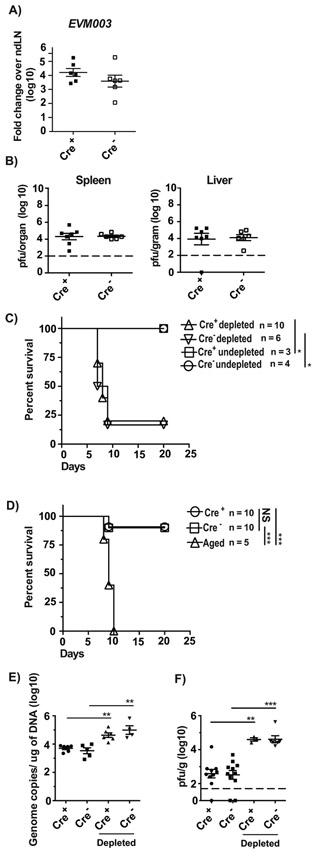
Figure 5. α2β1-deficient NK cells protect from lethal mousepox and from MCMV:
A) The indicated mice were infected with ECTV and at 72 hpi, the expression of the viral gene EVM003 in individual mice with mean ± SEM was determined in the dLN by RT-qPCR. Data correspond to two individual experiments combined with a total of 6-8 mice/group. B) The indicated mice were infected with ECTV and at 120 hpi, the virus loads in spleens or livers of individual mice with mean ± SEM were determined by plaque assay. Data correspond to two individual experiments combined with a total of 6-9 mice/group. The limit of detection is indicated by the dotted line (2 log). C) The indicated mice were depleted or not of NK cells with anti-NK1.1 mAb PK136 one day before and one day after infection with 3,000 pfu ECTV in the footpad. Survival was monitored. Data are displayed as a combination of two independent experiments with a total of 3-10 mice/group Statistical analysis was performed by Log-Rank test. For all, *p < 0.05; **p < 0.01. D) The indicated mice infected with 100,000 pfu ECTV in the footpad. Survival was monitored. Data are displayed as a combination of two independent experiments with a total of 5-10 mice/group Statistical analysis was performed by Log-Rank test. For all, *p < 0.05; **p < 0.01; ***p < 0.001. E-F) The indicated mice were depleted or not of NK cells with anti-NK1.1 mAb PK136 one day before and one, three, and five days after infection with 250,000 pfu of tissue-cultured MCMV K181 (E) or 10,000 pfu of salivary gland passaged MCMV V70 (F) i.p. Spleens were collected at 120 hpi and genome copies of MCMV E1 gene (E) or pfu (F) were calculated. Data are displayed as a combination of two or three independent experiments with a total of 3-11 mice/group. The limit of detection for pfu is indicated by the dotted line (1.7 log). P-values were calculated using the Mann-Whitney U statistical test or ANOVA when necessary. For all, *p < 0.05; **p < 0.01; ***p < 0.001; ****p < 0.0001.

