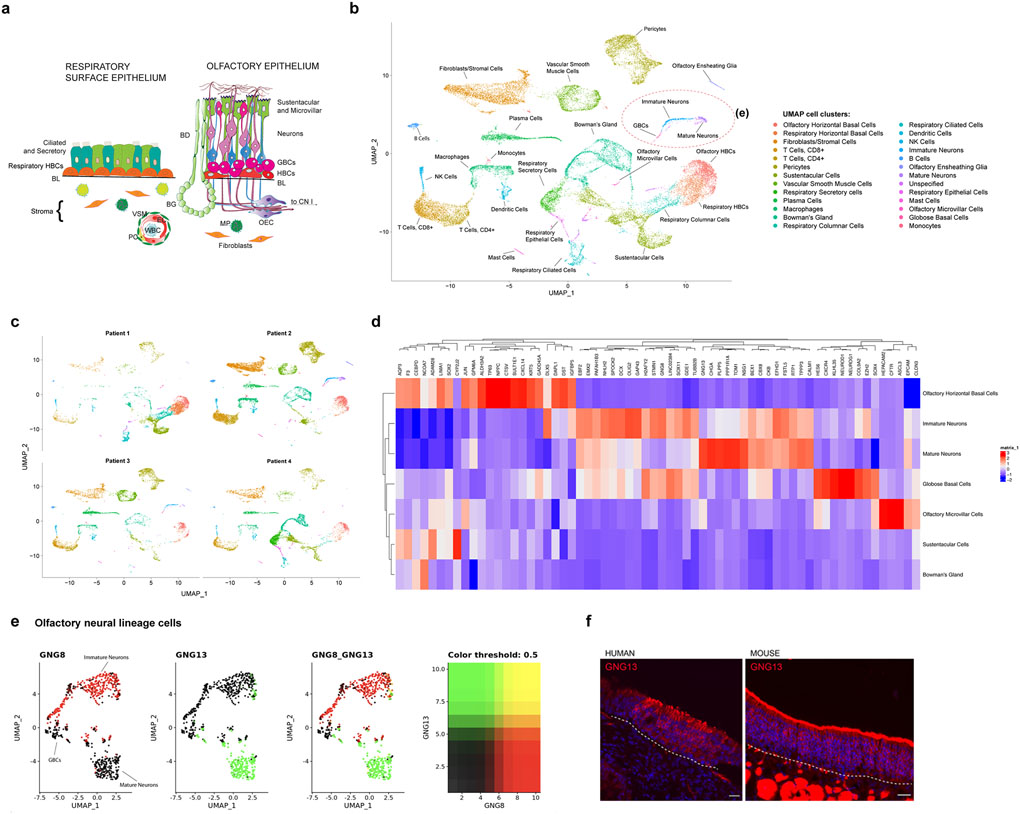
Fig. 1 |. Aggregate analysis of 28,726 single cells from human olfactory cleft mucosa.
a, Schematic diagram of the respiratory epithelium versus olfactory epithelium. Abbreviations: globose basal cells (GBCs), Horizontal basal cells (HBCs), Bowman’s ducts (BD), Bowman’s glands (BG), Vascular smooth muscle (VSM), Endothelial cell (EC), Pericyte (PC) White blood cell (WBC), Macrophage (MP), Olfactory ensheathing cell (OEC), Cranial Nerve I (CN1), basal lamina (BL) . b, UMAP dimensionality reduction plot of 28,726 combined olfactory and respiratory mucosal cells, n=4 patients. Cell cluster phenotype is noted on color key legend/labels. c, Plots of individual patient samples, n=4 patients. Patient 1: 5,683 cells; Patient 2: 11,184 cells; Patient 3: 5,538 cells; Patient 4: 6,321 cells; see also Extended Data Fig. 1c. d, Heatmap depicting selected gene expression among olfactory cell clusters. e, UMAP depicting GNG8 and GNG13 expression in 694 GBCs, immature olfactory neurons, and mature olfactory neurons, n=4 patients. f, GNG13 immunostaining (red) in adult human and mouse OE; dashed line marks basal lamina; nuclei are stained with DAPI (blue). Immunostaining was conducted in triplicate with similar results. Scale bar, 25 μm.

