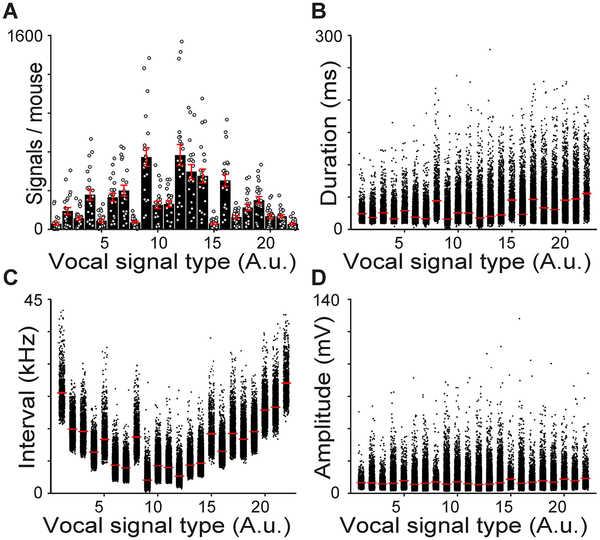
Fig. 4. Quantification of vocal repertoires.
A, Distributions of vocal signals clustered by shape (Average±SEM; n=484 biologically independent samples, 1-way ANOVA, F=21.0, p<10−54). Average±SEM of the duration (B), interval (C), and amplitude (D) for each vocal signal type. B-D, n=111,498 biologically independent samples, 1-way ANOVAs, all F>14.2, all p<10−38, red line = average, width of line = ±SEM

