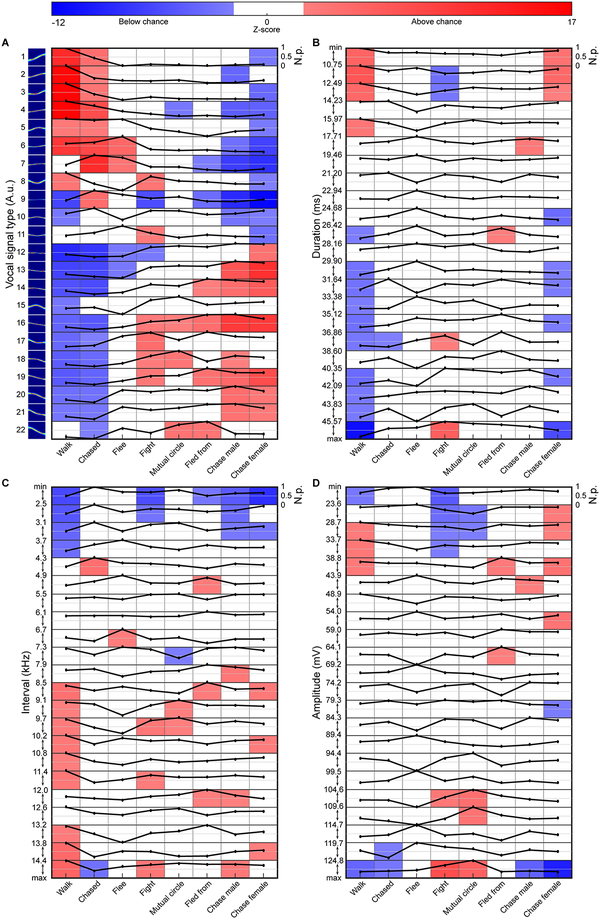
Fig. 6. Behaviorally-dependent vocal emission.
Differential expression of social context-dependent vocal expression indicating when signal types were emitted above (red), below (blue), and at chance (white). Chance level heat maps overlaid with black line indicating normalized probability (N.p.) of signal type emission. Signals categorized based on shape (A), duration (B), interval (C), and amplitude (D). A-D, 2-sided permutation tests, n=1000 independent permutations for each analysis.

