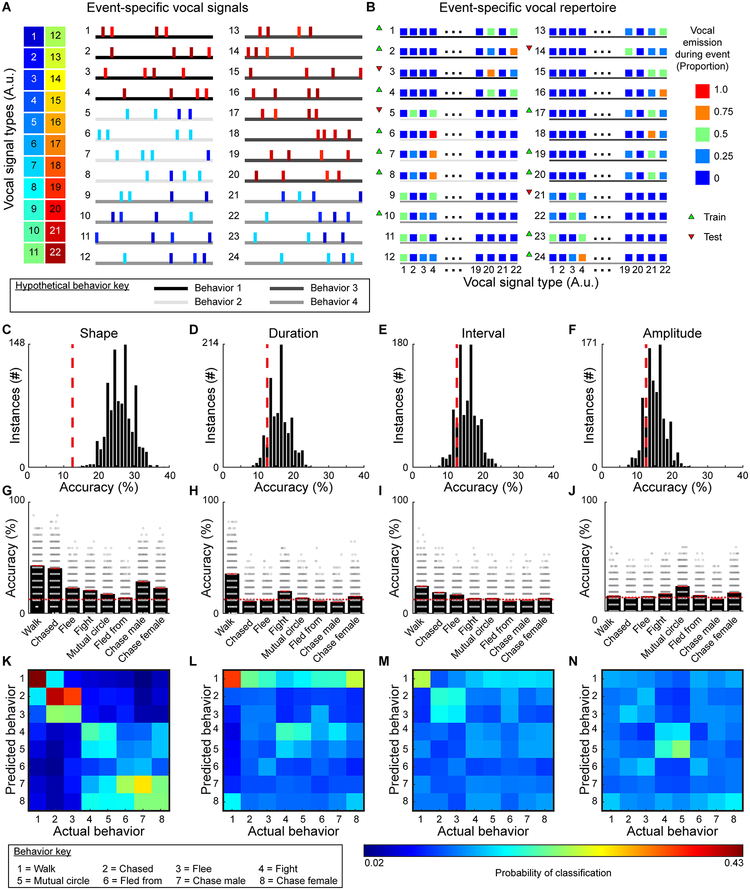
Fig. 7. Decoding behavior based on vocal emission.
A, Schematized vocal emission during 24 hypothetical events for 4 (of 8) different behavior categories (see Supplemental Figs 12, 13 for real events from all categorized behaviors). Horizontal lines denote 4 of the 8 different behaviors, with each behavior indicated by a shade of gray. B, Using the proportion of each vocal signal type emitted during each behavioral example, a multi-class support vector machine was independently trained and tested on random subsets of the data. C-F, Distributions of classifier accuracies when vocal signals were categorized by shape (2-sided permutation test, n=1000 independent permutations, z=−3.8, p<10−4), duration (z<−1.3, p>0.2), interval (z=−1.0, p>0.3), and amplitude (z=−0.9, p>0.3). Chance levels denoted by red dashed lines. G-J, Classifier accuracy for each behavior when signals were grouped based on shape, duration, interval, and amplitude (red line = average, width of line = ±SEM, red dashed lines = chance). For each analysis, the classifier was run 1000 times and every iteration predicted 17 examples of each behavior with accuracies shown as a dot. K-N, Confusion matrices showing classification errors.

