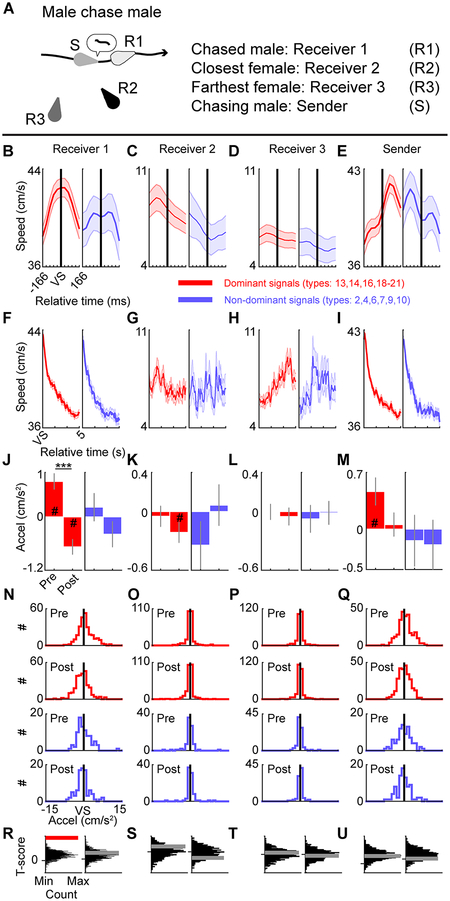
Fig. 8. Vocalizing alters behavior of an engaged social partner.
A, Schematic of a male mouse (Sender) chasing the other male (Receiver 1) as well as the closest (Receiver 2) and farthest (Receiver 3) females. B-E, Average speed±SEM for Receiver 1 (B), Receiver 2 (C), Receiver 3 (D), and Sender (E) before and after the emission of dominant (red) or non-dominant (blue) vocal signals (VS). There were 271 dominant and 86 non-dominant vocal signals included in the analyses. F-I, Average speed±SEM in the 5 seconds after the emission of dominant or non-dominant vocal signals. J-M, Acceleration of animals (Average±SEM; # indicates that an animal was accelerating (2-sided 1-sample t-test, all significant T>=2.73, all significant p<0.01) or decelerating (2-sided 1-sample t-test, all significant T<=−2.04, p<0.05); *** denotes significant differences in pre- and post-acceleration, 2-sided paired t-test, T=5.6, p<10−8). N-Q, Full data distribution for J-M. R-U, Randomly generated distributions of T-scores comparing pre- and post-acceleration calculated for signals that were randomly shifted to different times within a chase. T-score distributions were compared to the T-scores calculated in J-M. Red horizontal bar in R indicates above chance, 2-sided permutation test, n=1000 independent permutations, p<0.001; gray horizontal bars in R-U indicate chance, 2-sided permutation tests, n=1000 independent permutations, all p>0.27. Panels: left and right, dominant and non-dominant signals, respectively.

