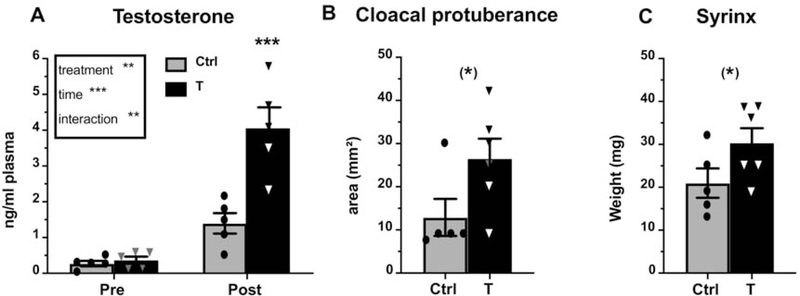
Figure 1.
(A) Plasma testosterone concentration (ng/ml) before the treatment (Pre) and at brain collection (Post) as well as cloacal protuberance size (B) and syrinx weight (C) at brain collection in control (light grey) and T-treated (black) castrated male canaries. Results of the 2-Way repeated measures ANOVA are summarized in the insert in panel A. Significant differences between treatments at each time point as determined by Tukey post hocs (panel A) or by unpaired t-test (panels B and C) are indicated above the corresponding bars. (*) =p<0.10, **= p<0.01, ***= p<0.001.

