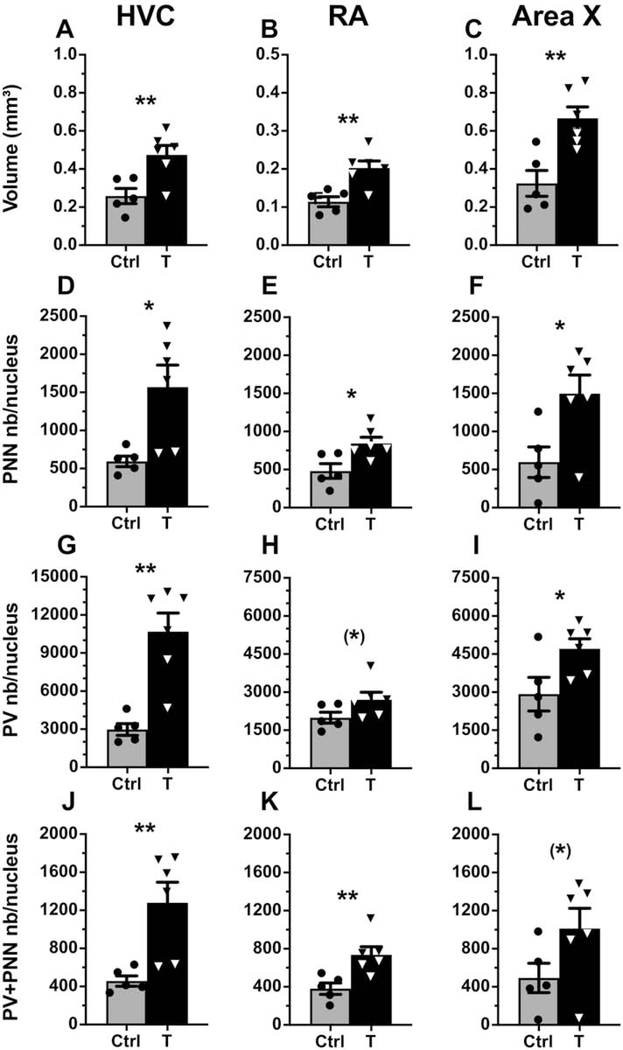
Figure 6.
(A-C) Nucleus volume (mm3), (D-F) total number of PNN/nucleus, (G-I) total number of PV/nucleus and (J-L) total number of PV+PNN/nucleus in HVC, RA and Area X of control (light grey) and T-treated (black) male canaries. Significant differences between groups identified by unpaired T-tests are indicated as follows: (*) p<0.10, * p<0.05, ** p<0.01.

