
Fig. 1 |. Inoculation of duodenum with α-Syn PFF impacts the ENS and GI function.
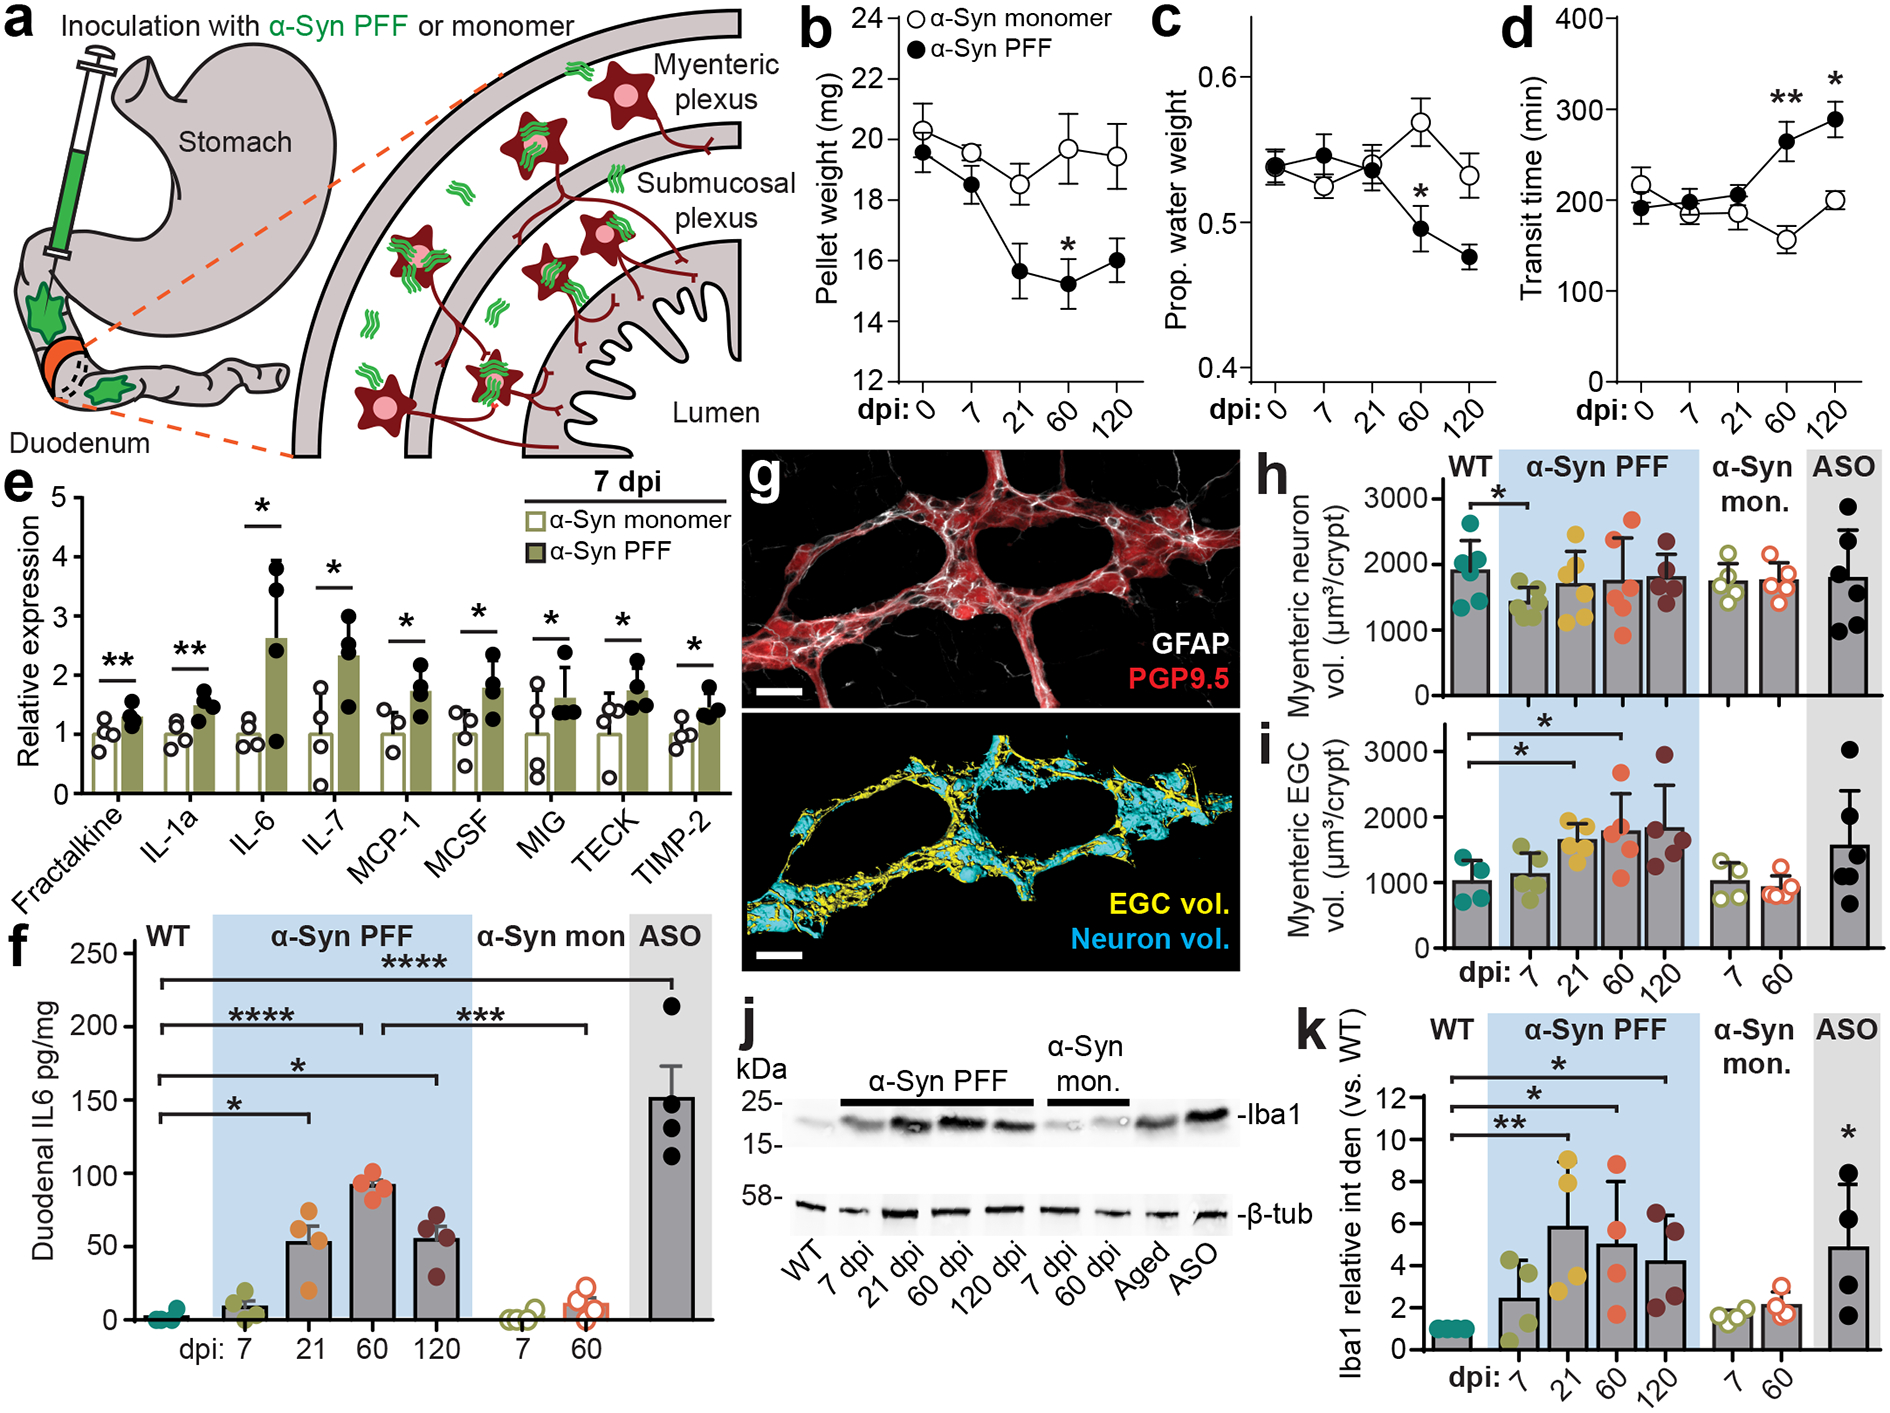
a, Schematic depicting intramuscular injection of the duodenum and interaction of injected material (α-Syn PFF, α-Syn monomer, BSA) with components of the intestinal wall, including the myenteric and submucosal plexus of the ENS, but not lumen. b-d, GI function following inoculation is characterized by determining fecal pellet weight (b; PFF vs. monomer, 60 dpi *p = 0.0187), proportion fecal water weight (c; PFF vs. monomer, 60 dpi *p = 0.0259), and whole gut fecal transit time (d; PFF vs. monomer, 60 dpi **p = 0.0012, 120 dpi *p = 0.0239). e, Densitometry analysis of cytokine expression from duodenal lysates 7 dpi with α-Syn PFF or α-Syn monomer. Values are normalized to the average of the α-Syn monomer group. (Fractalkine, **p = 0.0030; IL-1a, **p = 0.0070; IL-6, *p = 0.0415; IL-7, *p = 0.0400; MCP-1, *p = 0.0416; MCSF, *p = 0.0467; MIG, *p = 0.0412; TECK, *p = 0.0365; TIMP-2, *p = 0.0400). f, ELISA analysis of duodenal IL-6 levels (WT vs PFF: 21 dpi *p = 0.0366, 60 dpi ****p < 0.0001, 120 dpi *p = 0.0245; 60 dpi: PFF vs. monomer ***p = 0.0001; WT vs. ASO ***p < 0.0001). g, Immunohistochemical labeling of PGP9.5 (neurons) and GFAP (EGCs) visualizes myenteric ganglia (top). Three-dimensional renderings are then derived of neuronal and EGC volumes of the myenteric ganglion (bottom). The experiment was repeated in 44 independent mice, with similar results obtained. Scale bars, 30 μm. h-i, Quantification of digitally reconstructed duodenal myenteric neuronal (h; WT vs. PFF, 7 dpi *p = 0.0425) and EGC (i; WT vs. PFF, 120 dpi *p = 0.0232) volumes. j, Representative Western blots immunostained for the Iba1 microglial marker and β-tubulin control from duodenal lysates. k, Densitometry analysis of Iba1 expression from duodenal lysates, normalized to WT. ASO is statistically compared to WT (WT vs PFF, 21 dpi **p = 0.0039, 60 dpi *p = 0.0149, 120 dpi *p = 0.0467; WT vs. ASO *p = 0.0182). Data represented are mean ± s.e.m. P values were determined by two-way analysis of variance (ANOVA) (b-d), one-tailed Student’s t-test (e), or one-way ANOVA (f, h-i, k). The following n values represents number of independent animals for statistical evaluation: 1b and 1c, for 0 / 7 / 21 / 60 / 120 dpi: monomer = 9 / 9 / 9 / 8 / 8, PFF = 16 / 14 / 14 / 11 / 8; 1d, for 0 / 7 / 21 / 60 / 120 dpi: monomer = 6 / 7 / 6 / 6 / 6, PFF = 7 / 8 / 9 / 9 / 8; 1e, monomer and PFF = 4 each; 1f, all conditions = 4 each, except ASO = 5; 1h and 1i, WT = 6, ASO = 6, for 7 / 21 / 60 / 120 dpi: PFF = 6 / 6 / 5 / 5, for 7 / 60 dpi: monomer = 5 / 5; 1k, all conditions = 4 each.