
Extended Data Fig. 2. Visualization of the duodenal ENS and cell proliferation.
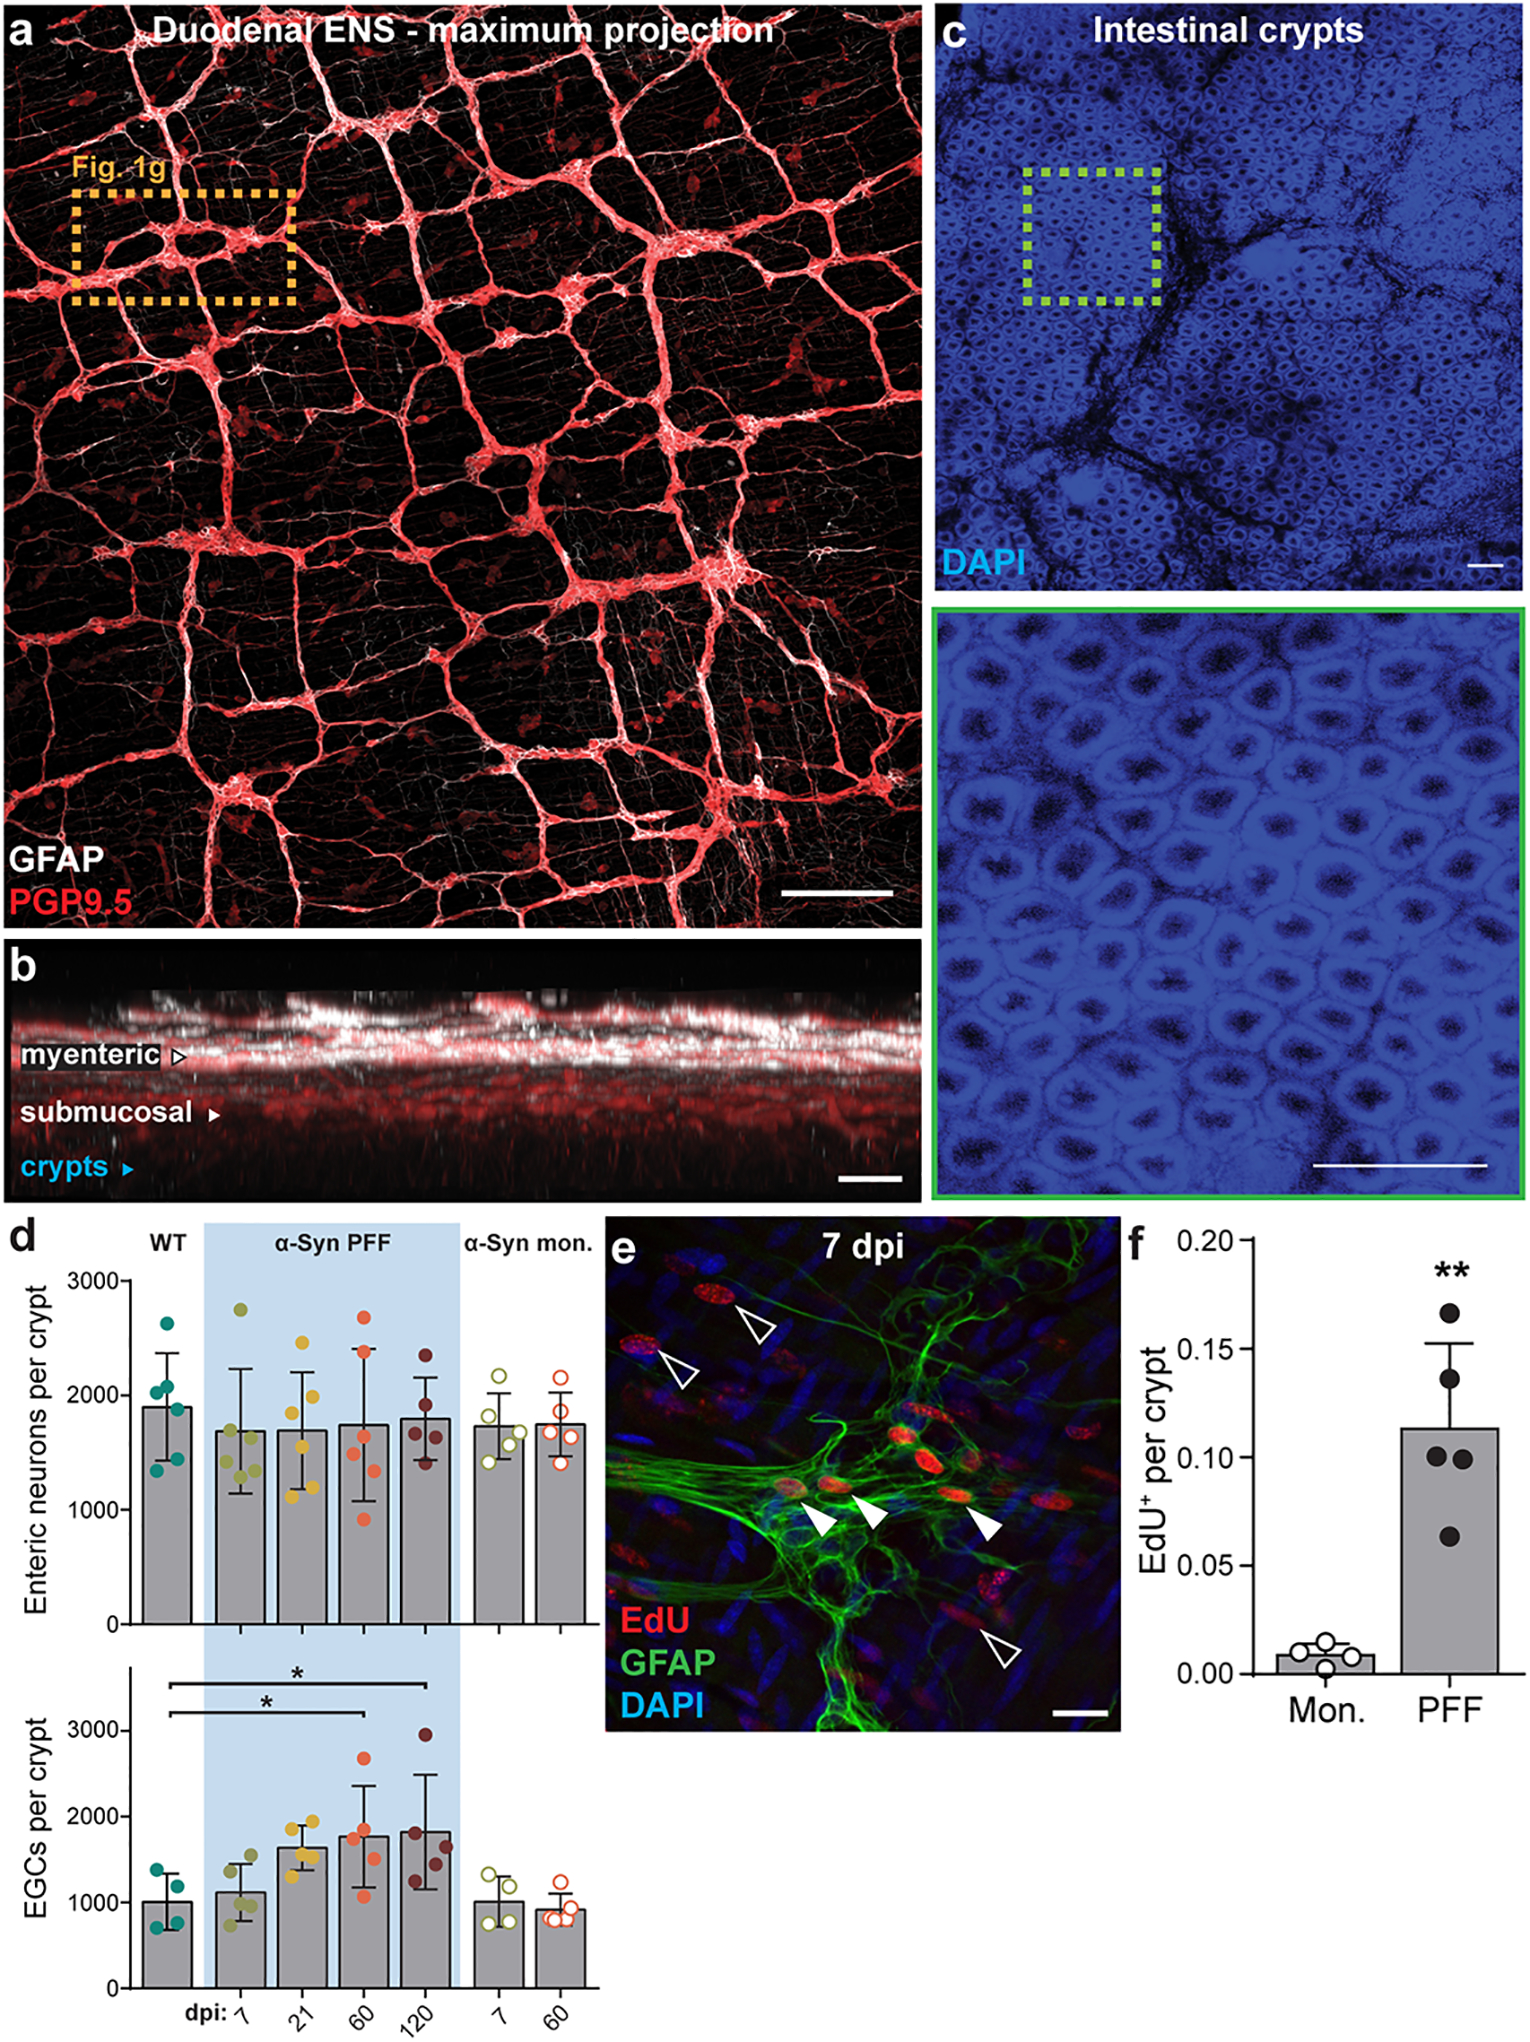
a, Maximum intensity projection confocal image of duodenum whole-mount stained for PGP9.5 (neurons) and GFAP (EGCs). Higher magnification of dashed box shown in Fig. 1g. Scale bar, 200 μm. b, Virtual cross-section of the duodenal wall after optical clearing distinguishes myenteric and submucosal plexuses. Intestinal crypt layer is marked in blue. Scale bar, 100 μm. c, DAPI nuclear labeling visualizes the intestinal crypt layer used for histological analysis of the ENS (top). High-magnification of dashed box shows individual crypts (bottom). Scale bars, 100 μm. Experimental images for (a-c) were obtained from 8 independent mice, with similar results obtained. d, Quantification of number of myenteric neurons per crypt (top) or myenteric EGCs per crypt (bottom; WT vs. PFF 60 dpi *p = 0.0329, WT vs. PFF 120 dpi *p = 0.0232) e, Immunohistochemical labeling of EdU detects recently proliferated extraganglionic (open arrows) or myenteric ganglion cells (closed arrows). EGCs are co-labeled with GFAP. Scale bar, 20 μm. f, Quantification of total EdU+ cells per crypt (Monomer vs. PFF *p = 0.0071). Data depicted is mean ± s.e.m. P values were determined by One-Way ANOVA (d) or one-tailed Student’s t-test (f). The following n values represents number of independent animals used for statistical evaluation: e2d enteric neurons per crypt, WT = 6, PFF 0 dpi = 6, PFF 7 dpi = 6, PFF 21 dpi = 6, PFF 60 dpi = 6, PFF 120 dpi = 5, monomer conditions = 5 each; e2d EGCs per crypt, WT = 4, all PFF = 5 each, monomer 7 dpi = 4, monomer 60 dpi = 5; e2f, monomer = 4, PFF = 5.