
Extended Data Fig. 4. GBA1 gene transfer increases GCase function and improves GI health.
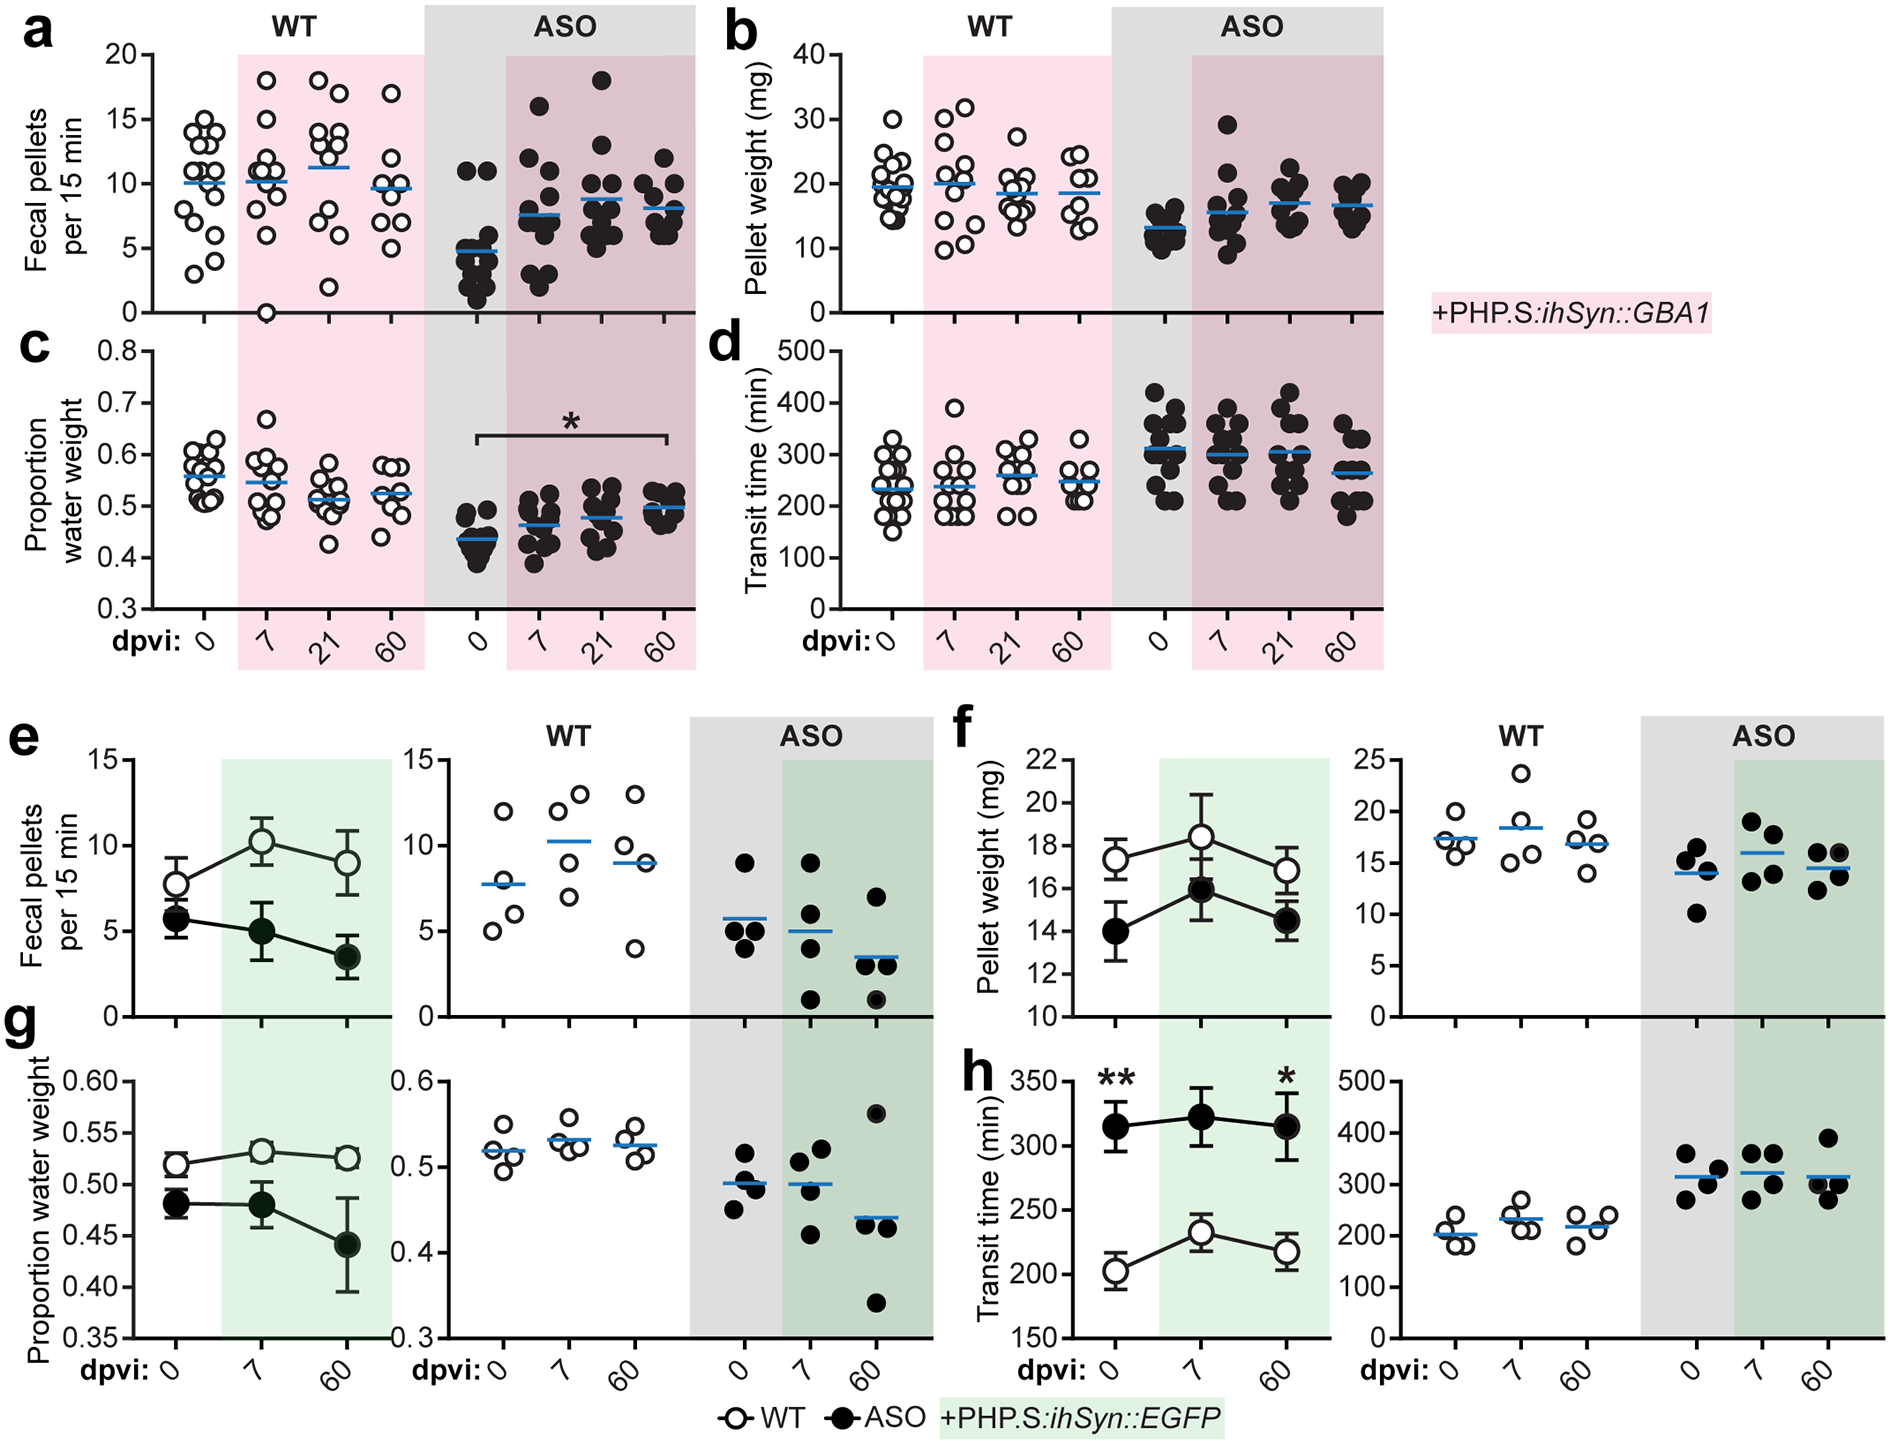
a-d, Characterization of GI function before and after peripheral GBA1 gene transfer by quantifying fecal pellet production (b), fecal pellet weight (c; ASO 0 vs. 60 dpvi *p = 0.0265), proportion fecal water weight (d), and whole gut fecal transit time (e). e-h, Characterization of GI function before and after peripheral EGFP gene transfer by quantifying fecal pellet production (e), fecal pellet weight (f), proportion fecal water weight (g), and whole gut fecal transit time (h; 0 dpi WT vs. ASO **p = 0.0085, 60 dpi WT vs. ASO *p = 0.0293). Data depicted are mean ± s.e.m. P values were determined by two-way ANOVA (a-h). The following n values represents number of independent animals used for statistical evaluation: e4a-d, for 0 / 7 / 21 / 60 dpi: WT = 17 / 12 / 11 / 8, ASO = 13 / 12 / 11 / 10; e4e-h, all conditions = 4 each.