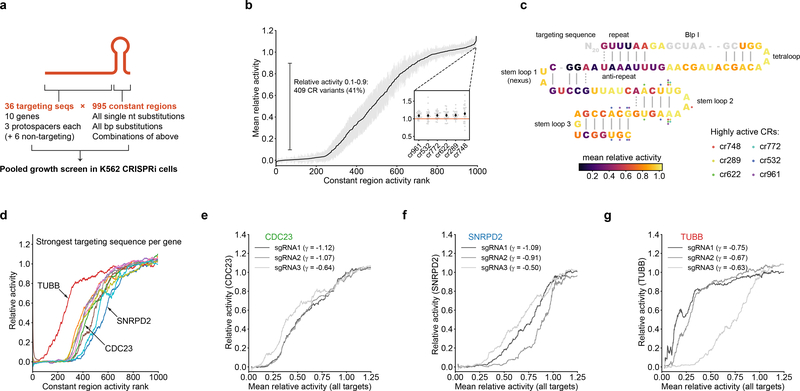
Figure 3.
Identification and characterization of intermediate-activity constant regions. (a) Design of constant region variant library. (b) Mean relative activities of constant region variants, calculated by averaging relative activities for all targeting sequences; n = 995 constant region variants, gray margins denote 95% confidence interval of 30 targeting sequences. Inset: Focus on 6 constant region variants with higher activity than the original constant region. Black diamonds denote mean relative activity, gray dots denote relative activities of individual targeting sequences. (c) Mapping of constant region variant relative activities onto the constant region structure. Each constant region base is colored by the average relative activity of the three constant region variants carrying a single mutation at that position. Positions mutated in 6 highly active constant regions (inset in panel b) are indicated by colored dots. The BlpI site (gray) is used for cloning and was not mutated. (d) Constant region activities by targeting sequence, plotted against ranked mean constant region activity. For each gene, the activities with the strongest targeting sequence are shown as rolling means with a window size of 50. (e-g) Constant region activities by targeting sequence for all three targeting sequences against the indicated genes. Growth phenotypes (γ) of each targeting sequence paired with the unmodified constant region are indicated in the legend.

