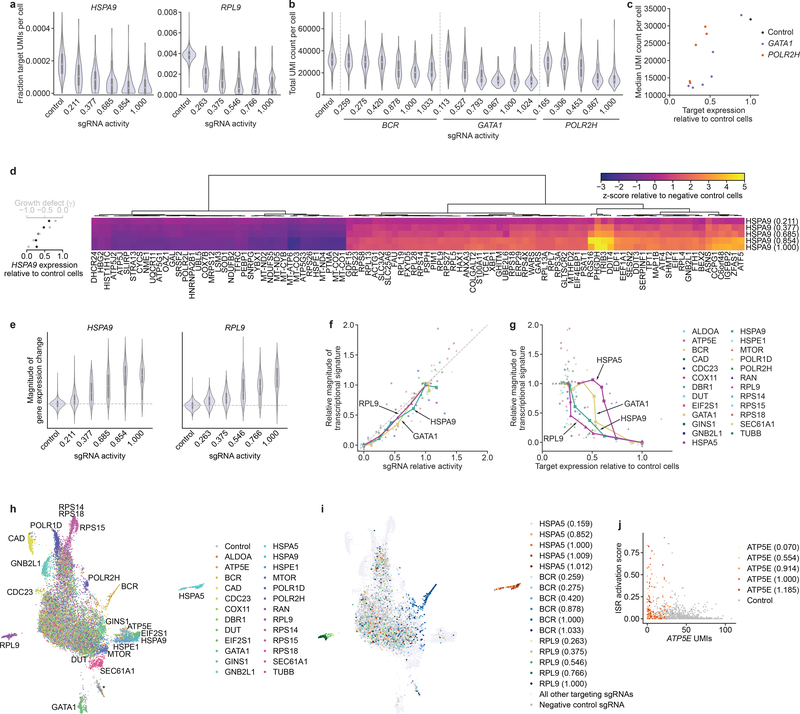
Figure 6.
Rich phenotyping of cells with intermediate-activity sgRNAs by Perturb-seq. (a) Distributions of HSPA9 and RPL9 expression in cells with indicated perturbations. Expression is quantified as target gene UMI count normalized to total UMI count per cell. sgRNA activity is calculated using relative γ measurements from the Perturb-seq cell pool after 5 days of growth. (b) Distributions of total UMI counts in cells with indicated perturbations. (c) Comparison of median UMI count per cell and target gene expression in cells with GATA1- or POLR2H- targeting sgRNAs. (d) Right: Expression profiles of 100 genes in populations with HSPA9-targeting sgRNAs. Genes were selected by lowest FDR-corrected p-values in cells with the strongest sgRNA from a two-sided Kolmogorov-Smirnov test (Methods). Expression is quantified as z-score relative to population of cells with non-targeting sgRNAs. Left: Growth phenotype and knockdown for each sgRNA. (e) Distribution of gene expression changes in populations with indicated sgRNAs. Magnitude of gene expression change is calculated as sum of z-scores of genes differentially expressed in the series (FDR-corrected p < 0.05 with any sgRNA in the series, two-sided Kolmogorov-Smirnov test, Methods), with z-scores of individual genes signed by the direction of change in cells with the perfectly matched sgRNA. Distribution for negative control sgRNAs is centered around 0 (dashed line).
For a-e, the cell numbers for each perturbation are listed in Table S14. Box plots inside violin plots denote quartile ranges (box), median (center mark), and 1.5 × interquartile range (whiskers).
(f) Comparison of relative growth phenotype and magnitude of gene expression change for all individual sgRNAs. Growth phenotype and magnitude of gene expression change are normalized in each series to those of the sgRNA with the strongest knockdown. (g) Comparison of magnitude of gene expression change and target gene knockdown, as in f. (h) UMAP projection of all single cells with assigned sgRNA identity in the experiment, colored by targeted gene. Clusters clearly assignable to a genetic perturbation are labeled. Cluster labeled * contains a small number of cells with residual stress response activation and could represent apoptotic cells. Note that ~5% cells appear to have confidently but incorrectly assigned sgRNA identities (Methods). Given the strong trends in the other results, we concluded that such misassignment did not substantially affect our ability to identify trends within cell populations and in the future may be avoided by approaches to directly capture the expressed sgRNA41. n = 19,587 cells. (i) UMAP projection, as in h, with selected series colored by sgRNA activity. n = 19,587 cells. (j) Comparison of extent of ISR activation to ATP5E UMI count in cells with knockdown of ATP5E or control cells.

