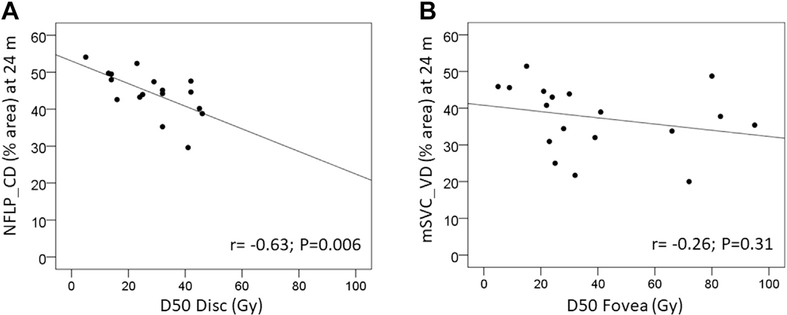
Figure 4.
A, Scatterplot showing that peripapillary nerve fiber layer capillary density (NFLP_CD) at 24 months correlates with the radiation dose (Gy) to the optic nerve as measured by radiation dose to 50% of the optic disc (D50 disc). The relationship between NFLP_CD and D50 disc was examined using Pearson’s correlation coefficient. Each eye is indicated with a point on the plot. A best-fit line is shown. B, Scatterplot showing a similar trend between the radiation dose to 50% of the fovea and the macular superficial vascular complex vessel density (mSVC_VD), although this was not statistically significant. P< 0.05 was used to define significance.

