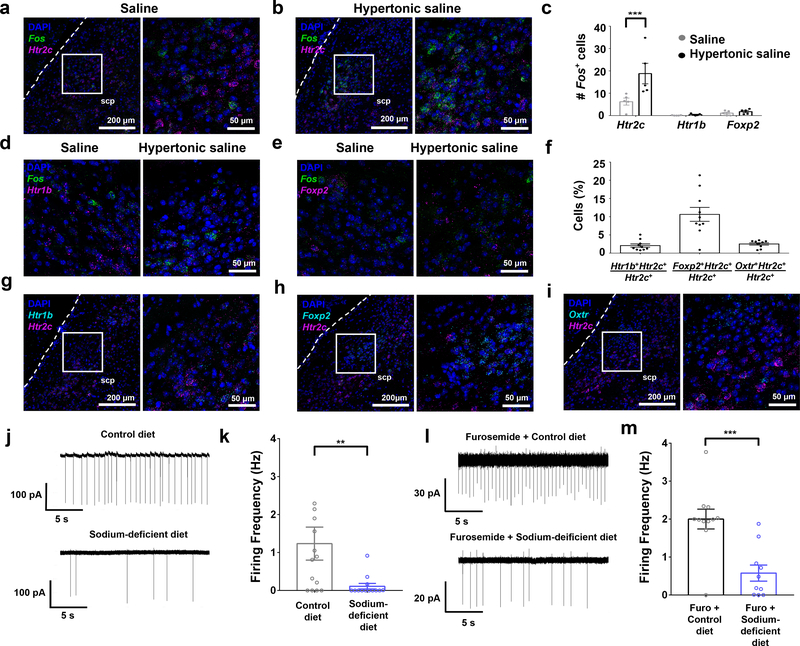
Figure 1. LPBNHtr2c neurons are regulated by bodily sodium content.
(a) Colocalisation of Fos and Htr2c in the LPBN after gastric loading of saline. Low magnification picture (left), higher magnification of area inside white box (right). Scale bars, left = 200 μm, right = 50 μm. Dashed lines indicate ventral spinocerebellar tract. scp = superior cerebellar peduncle. (b) Colocalisation of Fos and Htr2c in the LPBN after gastric loading of hypertonic saline. Low magnification picture (left), higher magnification of area inside white box (right). Scale bars, left = 200 μm, right = 50 μm. (c) Quantification of Fos expressing neurons that co-express Htr2c, Htr1b or Foxp2. Data points represent average number of cells counted per slice for each animal. Saline N = 5 mice, Hypertonic saline N =5 mice. Two-Way ANOVA: treatment (F(2,24) = 22.72, P < 0.0001), gene (F(1, 24) = 7.671, P = 0.0107), interaction (F(2, 24) = 5.949 P = 0.0080). All post hoc tests done using the Bonferroni correction, P = 0.000552. (d) Colocalisation of Fos with Htr1b in the LPBN after gastric loading of saline or hypertonic saline. Scale bar = 50 μm. (e) Colocalisation of Fos with Foxp2 in the LPBN after gastric loading of saline or hypertonic saline. Scale bar = 50 μm. (f) Quantification of percentage of Htr2c neurons that coexpress Htr1b, Foxp2 or Oxtr. Data points represent average percentages counted per slice for each animal. N = 10 mice. (g) Colocalisation of Htr1b with Htr2c in the LPBN. Low magnification picture (left), higher magnification of area inside white box (right). Scale bars, left = 200 μm, right = 50 μm. (h) Colocalisation of Foxp2 with Htr2c in the LPBN. Low magnification picture (left), higher magnification of area inside white box (right). Scale bars, left = 200 μm, right = 50 μm. (i) Colocalisation of Oxtr with Htr2c in the LPBN. Low magnification picture (left), higher magnification of area inside white box (right). Scale bars, left = 200 μm, right = 50 μm. (j) Representative cell-attached recording of an LPBNHtr2c neuron after 7–8 days of control diet (upper), or 7–8 days of sodium-deficient diet (lower). (k) Firing frequency of LPBNHtr2c neurons between control diet-fed mice (left) and sodium-deficient diet-fed mice (right). Two-tailed Mann-Whitney test. Control diet n = 14 cells, sodium-deficient diet n = 13 cells. Control diet 1.2 ± 0.4 Hz, Sodium-deficient diet 0.1 ± 0.1 Hz. P = 0.008. (l) Representative cell-attached recording of an LPBNHtr2c neuron after furosemide and control diet treatment (upper) or furosemide and sodium-deficient diet treatment (lower). (m) Firing frequency of LPBNHtr2c neurons between control diet fed mice (left) and sodium-deficient diet fed mice (right). Two-tailed Mann-Whitney test. Furosemide + control diet n = 11 cells, furosmide + sodium-deficient diet n = 10 cells. Furosemide + control diet 2.0 ± 0.3 Hz, furosemide + sodium-deficient diet 0.6 ± 0.2 Hz. P = 0.0007. All data represented as mean ± s.e.m. **P < 0.01, ***P < 0.001.

