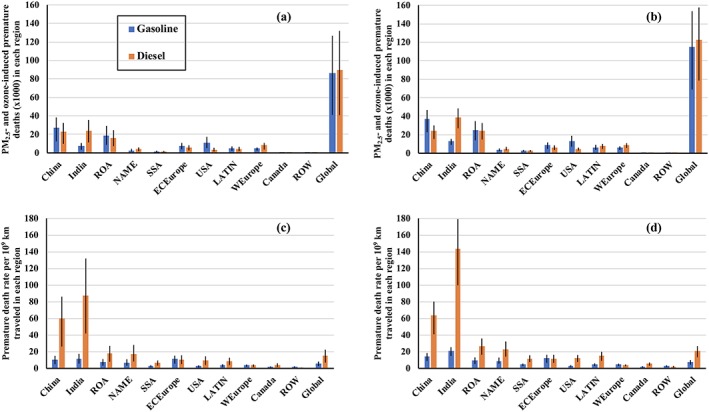
Figure 5.

PM2.5‐ and O3‐induced annual‐mean premature deaths (a, b) and premature death rate per 109 km traveled (c, d) from emissions of gasoline (blue) and diesel (orange) for 11 different regions, with O3 impacts on COPD following J2009 shown in (a, c) and T2016 shown in (b, d), respectively. The regional premature death rate is calculated as the regional total premature deaths divided by the total annual regional distances traveled for each fuel type. Error bars represent 95% confidence intervals, which is solely based on the uncertainty range of relative risk.
