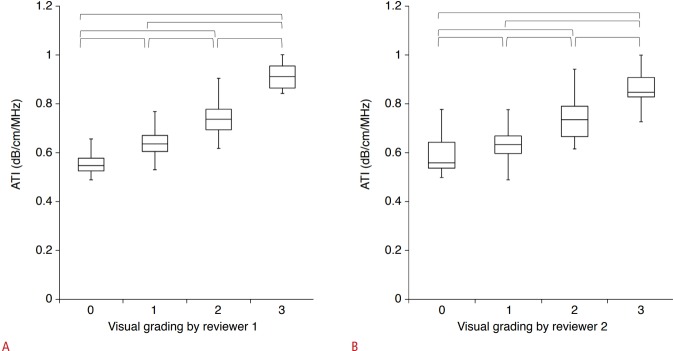
Fig. 2. Box-and-whisker plots of the mean attenuation coefficient according to the visually assessed steatosis grade of both (A) reviewer 1 and (B) reviewer 2.
A, B. Boxes show the median and 25th and 75th percentiles, and whiskers show the minimum and maximum values. Horizontal brackets mean significant differences between each steatosis grade using the Jonckheere-Terpstra and Mann-Whitney U tests. ATI, attenuation imaging.

