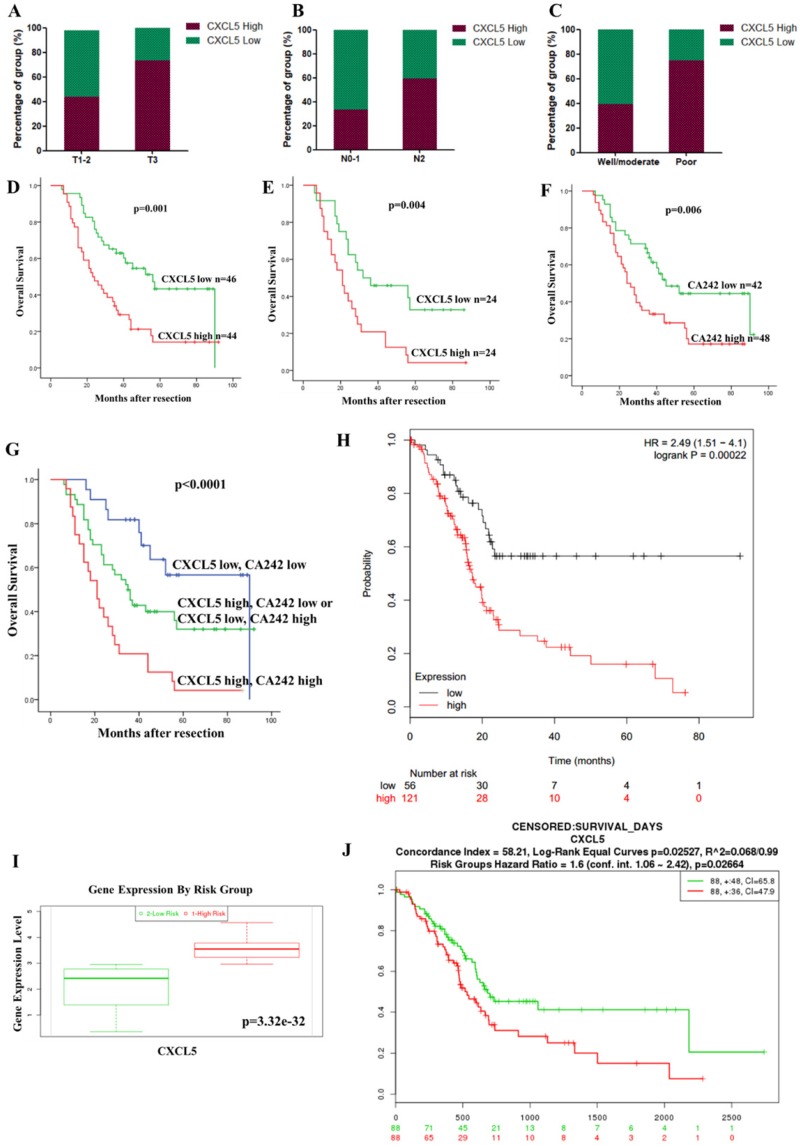
Figure 2.
Correlation between CXCL5 expression and clinicopathological features and prognosis. (A-C) Expression of CXCL5 in tumor tissues with different T stages, N stages and differentiation statuses. (D) The influence of tumoral CXCL5 expression on OS (p=0.001, log-rank test). (E) The multivariate Cox regression analysis showed that CXCL5 expression was an independent factor in the high CA242 subgroup (HR=2.047, p=0.004). (F) PDAC patients with high CA242 levels had worse OS than those with low CA242 levels (p=0.006). (G) The combination of CXCL5 expression and CA242 was a good prognostic factor (p<0.0001). (H) The results from SurvExpress, showed that high CXCL5 expression was associated with poor OS in PDAC patients (p=0.00022). (I) Comparison of CXCL5 expression between patients in the “High Risk” group and those in the “Low Risk” group through the SurvExpress program (p=3.32e-32). (J) The prognostic value of CXCL5 mRNA expression in the Kaplan-Meier plotter dataset (HR=1.6, p=0.02664).

