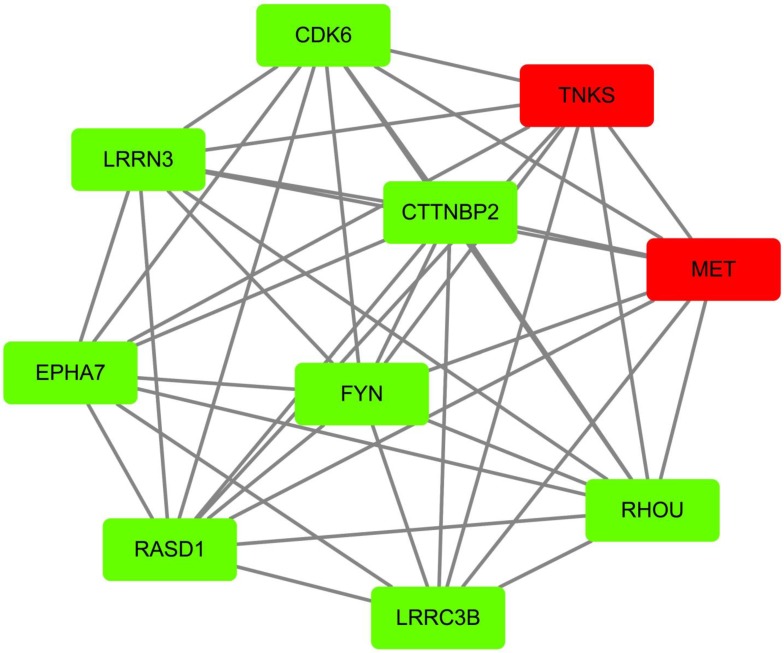
Figure 3.
Identification of core PPI network in breast cancer. Co-expressed network of up-regulated differently expressed genes presented by node and edge by the analyzer of cytoscape. The red nodes indicate more protein that could interact with this node, while the green node indicates less protein integrators.

