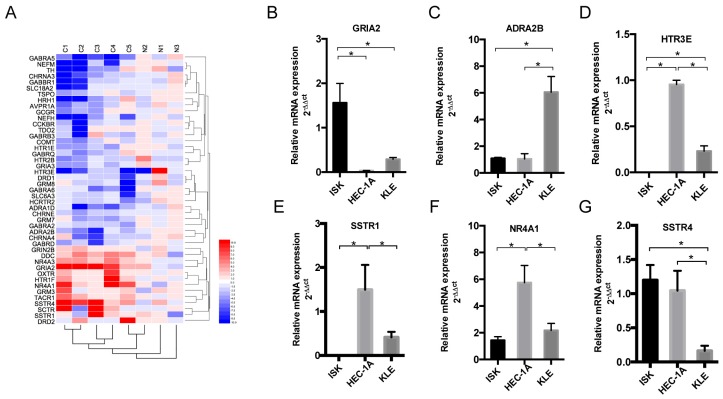
Figure 2.
Expression of nerve-related receptor genes in EC tissue and cell lines. (A) Clustered heat map of differentially expressed nerve-related genes in endometrial cancer and para-cancer normal tissue (C1-C5 represents cancer tissues, N1-N3 represents normal tissues); 45 genes displayed a ≥2-fold increase or decrease in expression level. Each color patch represents the expression level of related genes with a continuum of expression levels from blue (lowest) to red (highest). (B-G) Expression of interested nerve-related receptor genes in EC cells lines (Ishikawa, HEC-1A and KLE) detected at the mRNA level; *P<0.05.

