Figure 2.
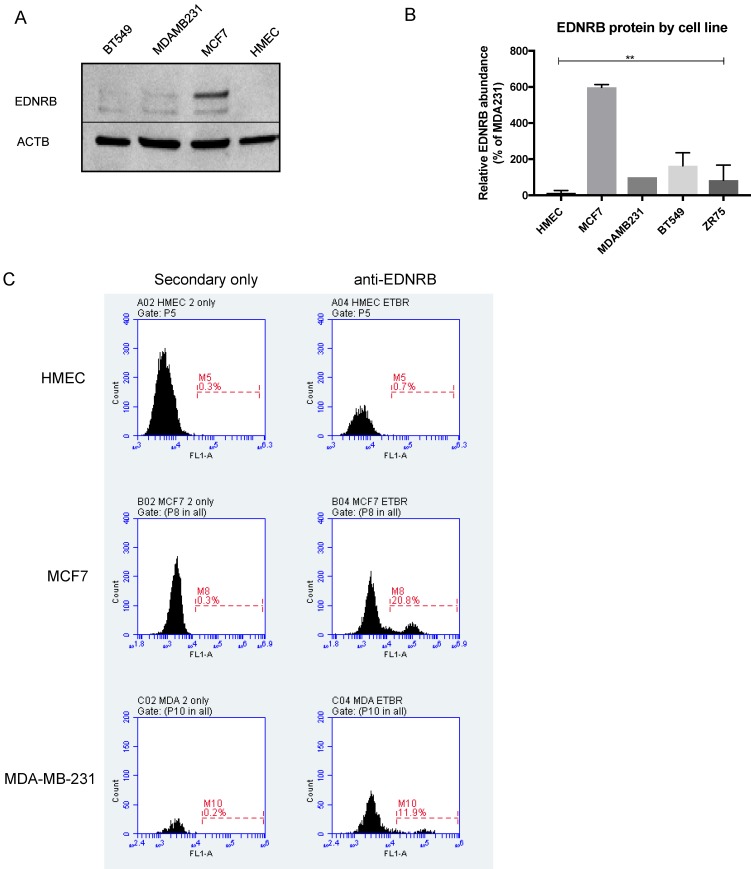
EDNRB protein expression in breast cancer cell lines. (A) Representative Western blot showing EDNRB protein expression in HMEC, MCF-7, MDA-MB-231 and BT-549 cell lines; (B) Semi-quantitative analysis of EDNRB relative to beta-actin (ACTB) in 3 biological replicates (2-way ANOVA p<0.0001); (C) representative flow cytometry charts showing EDNRB cell-surface expression in HMECs (top), MCF7 (middle), and MDA-MB-231 (bottom) cell lines.

