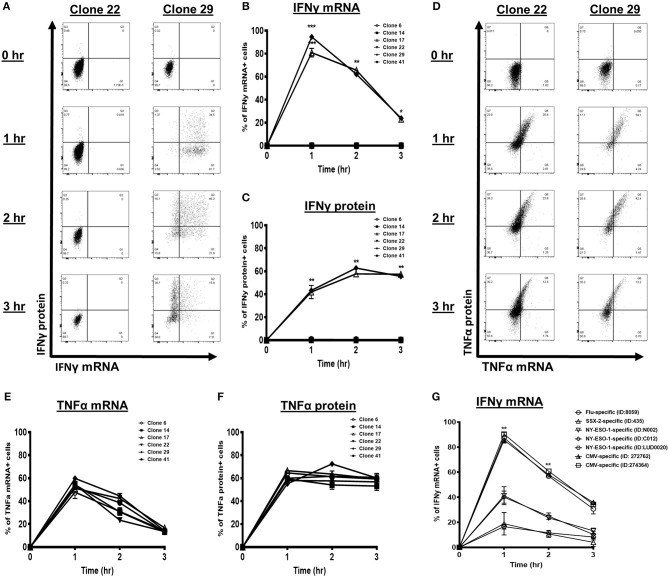
Figure 4.
Interferon gamma (IFNγ) kinetics of synovial sarcoma X (SSX)-2-specific T cell clones and short-term expanded bulk antigen-specific cytotoxic T lymphocytes (CTLs). (A) Flow cytometry dot plots of IFNγ mRNA and protein levels following co-culture with CD3/CD28 activator antibody at the indicated time points. Proportion of cells with IFNγ mRNA (B) and protein (C) following co-culture with CD3/CD28 activator antibody at the indicated time points. (D) Histogram plots of TNFα mRNA and protein levels following co-culture with CD3/CD28 activator antibody at the indicated time points. Proportion of cells with TNFα mRNA (E) and protein (F) following co-culture with CD3/CD28 activator antibody at the indicated time points. (G) IFNγ mRNA level of each antigen-specific T cell type [influenza-specific T cells, cytomegalovirus (CMV)-specific T cells, SSX-2-specific T cells, and New York-esophageal squamous cell carcinoma-1 (NY-ESO-1)-specific T cells derived from different patients] following treatment with CD3/CD28 activator antibody for 0, 1, 2, and 3 h. N, number of experimental repeats = 3. *P < 0.05, **P < 0.01, ***P < 0.001; analysis performed with two-way ANOVA with Tukey's multiple comparison.

