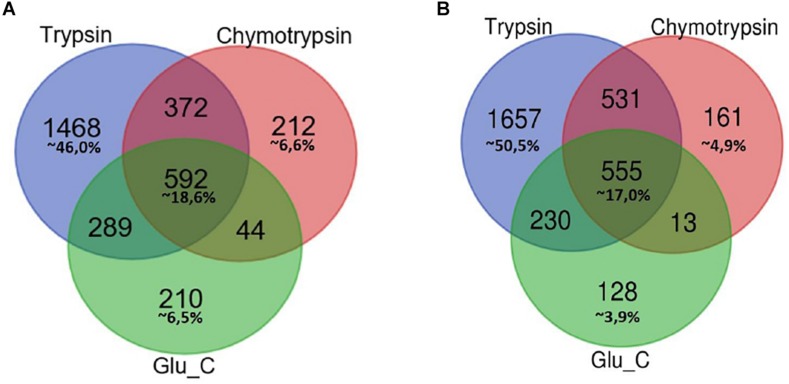
FIGURE 1.
Venn Diagram of protein identification obtained by multiple enzyme digestion approach. Venn diagrams represent the overlap of the lists of proteins IDs detected by LC-MS/MS experiments upon proteolytic digestion with the three enzymes trypsin, chymotrypsin and GluC. The number of IDs uniquely identified by trypsin, Glu-C and chymotrypsin enzymatic digestion and/or number of proteins identified by two or three alternative and independent enzymatic digestion are indicated, respectively, in F1 (A) and F2 fractions (B).

