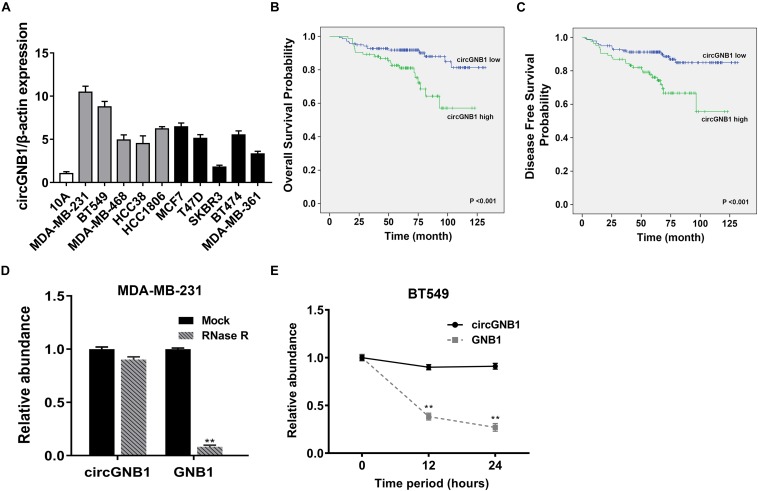
FIGURE 1.
circGNB1 is upregulated in TNBC and correlated with poor clinical outcomes. (A) The expression level of circGNB1 in normal mammary cell line MCF-10A and breast cancer cell lines. Gray bar and black bar represent for TNBC and non-TNBC cell lines, respectively. (B,C) Kaplan–Meier analysis of the (B) overall survival and (C) disease-free survival of 222 TNBC patients with circGNB1 high (green) or low (blue) expression levels. (D) Relative abundance of circGNB1 and GNB1 mRNA after treatment with RNase R in MDA-MB-231 cells. (E) Relative abundance of circGNB1 and GNB1 mRNA after being treated with Actinomycin D in BT-549 cells.

