Figure 2.
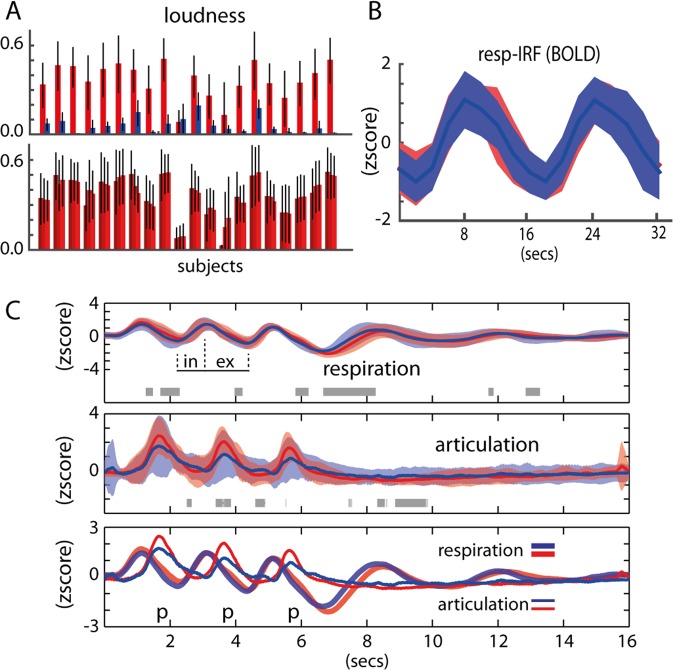
Behavioral results. (A) Upper: Loudness per task across all participants. Red is voiced and blue is whispered speech. Bottom: Loudness per item repetition (3 items are produced per trial) across all participants for the voiced speech task. (B) Respiratory impulse response function (resp-IRF) using the average BOLD fluctuation within all cortical voxels. (C) Group results of the respiratory and articulatory recordings, red is voiced and blue is whispered speech: upper: voiced and whispered respiratory fluctuations (standard errors from the mean is shaded); gray horizontal bars refer to t-test differences (p < 0.05); ‘in’ and ‘ex’ depict inhale and exhale periods, respectively; middle: voiced and whispered articulatory fluctuations; bottom: combined respiratory and articulatory fluctuations.

